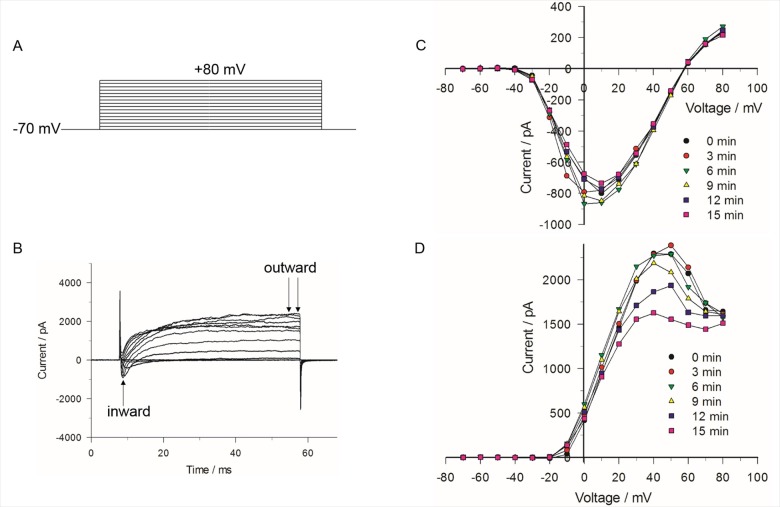
Fig 2. I-V relationships for early peak inward and late outward currents.
(A) The voltage step protocol consisted of 50 ms steps ranging from –70 to +80 mV, applied in 10 mV increments every 2 s. (B) Corresponding traces of the early inward and late outward current elicited by the voltage step protocol. (C) I-V relationship for the peak inward current (arrow in (B)) obtained for each of 6 successive voltage step protocols applied to the same cell. The interval between each protocol was 3 min for a total elapsed time of 21 min. (D) Corresponding I-V relationship for the outward current of the same cell shown in (C). Current represents the mean value of the late outward current for the interval between the arrows in (B). The results are representative of 5 cells.

