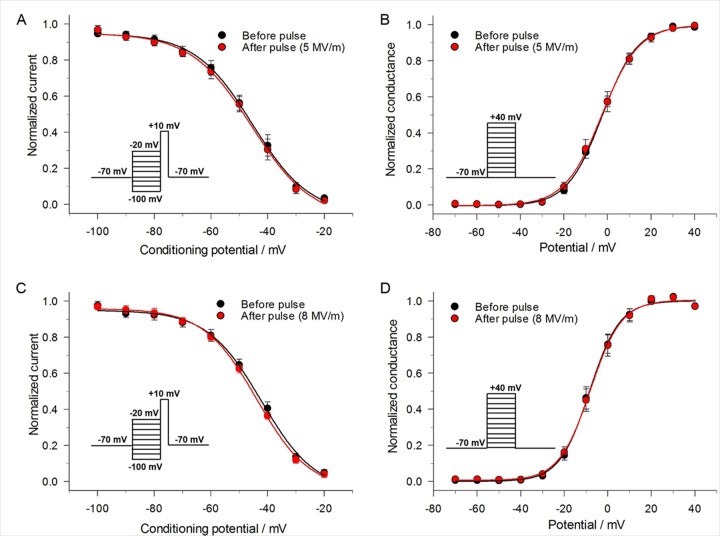
Fig 6. Effect of a single 5 ns pulse on the voltage-dependence of steady-state inactivation and activation of INa.
(A) Steady-state inactivation of INa was determined by holding cells at –70 mV and applying a series of 1 s conditioning potentials ranging from –100 mV to –20 mV in 10 mV increments, with each voltage step followed by a constant 100 ms test pulse to +10 mV to record INa (inset). A 5 MV/m pulse was delivered and after 1 s the voltage step protocol repeated. INa in each case was normalized to their respective maximal values and plotted as a function of the conditioning potential. The data were fitted to a Boltzmann function (see Methods) and expressed as the mean ± SE (n = 4). (B) Steady-state activation of Na+ at an E-field of 5 MV/m. Steady-state activation of INa was determined by holding cells at –70 mV and applying 50 ms steps ranging from –70 mV to +40 mV in 10 mV increments every 2 s (inset). A 5 MV/m pulse was delivered and after 1 s the voltage step protocol repeated. Peak Na+ current in each case was converted to conductance (see Methods), normalized to their respective maximal values and fitted to a Boltzmann function. Data are expressed as the mean ± SE (n = 6). (C) Same as in (A) for a pulse applied at an E-field of 8 MV/m (n = 6). (D) Same as in (B) for a pulse applied at an E-field of 8 MV/m (n = 5).

