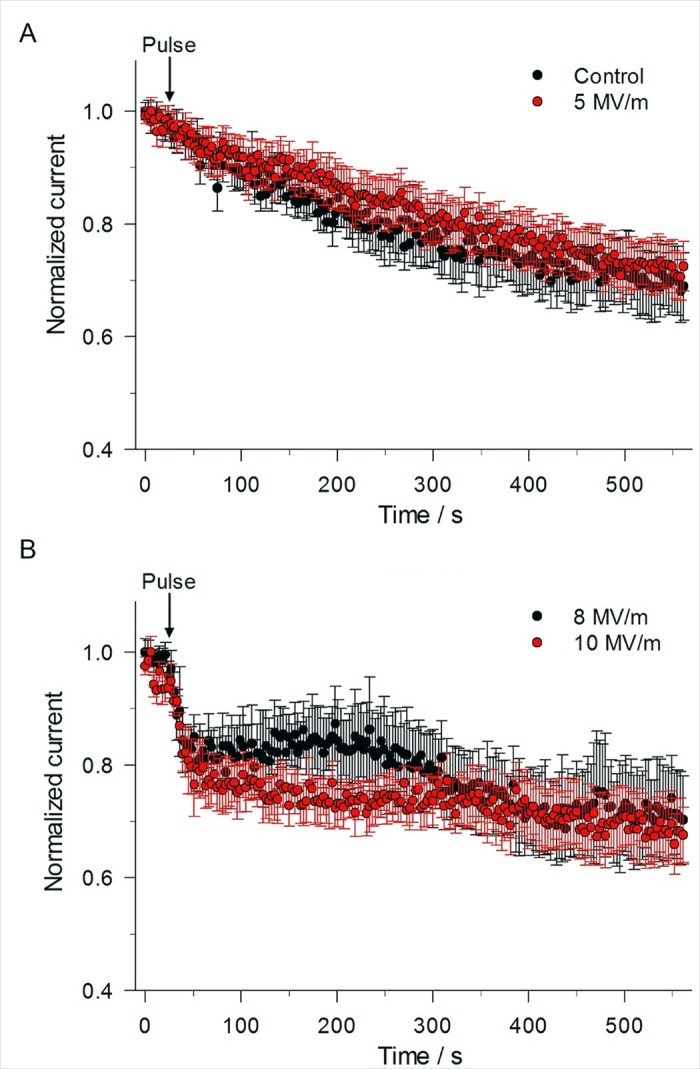
Fig 8. Effect of single 5 ns pulse at different E-field amplitudes on late outward current.

(A) Time course of the changes in mean outward current for an unexposed cell (control) compared to a cell exposed to a 5 ns, 5 MV/m pulse, obtained by using the constant-voltage step protocol described in Fig 4A in which the voltage was stepped from –70 mV to +10 mV for 100 ms. Normalized current represents the mean magnitude of the late outward current (see Fig 4B) normalized to the mean of the late outward current recorded for the 8 voltage step protocols that immediately preceded the 21st voltage step protocol. Data are expressed as the mean ± SE (Control, n = 11; 5 MV/m, n = 9). (B) Time course of the changes in mean outward current for a cell exposed to a 5 ns pulse at E-fields of 8 MV/m and 10 MV/m (8 MV/m, n = 3/10; 10 MV/m, n = 6/11). In both (A) and (B), the results were obtained from the same cells as those shown in Fig 5 for peak inward current.
