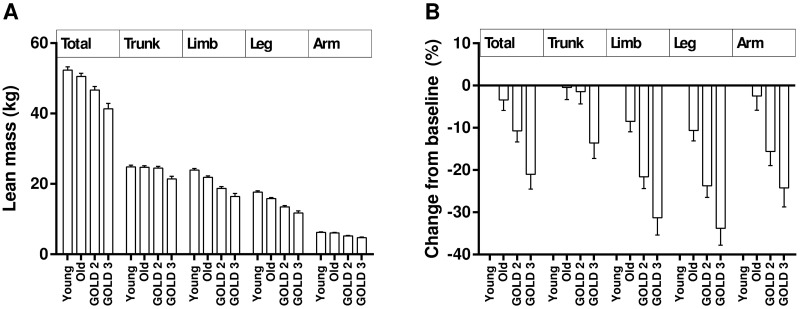
Fig 1. Changes in lean mass variables.
(A) Total and segmental lean mass changes among groups. (B) Percentage changes of total and segmental lean mass variables compared with the healthy young adult group. Data were expressed as mean ± standard error of mean. Young, healthy young subjects aged 20–45 years; Old, healthy old subjects aged ≥ 60 years; GOLD, The Global Initiative for Chronic Obstructive Lung Disease.

