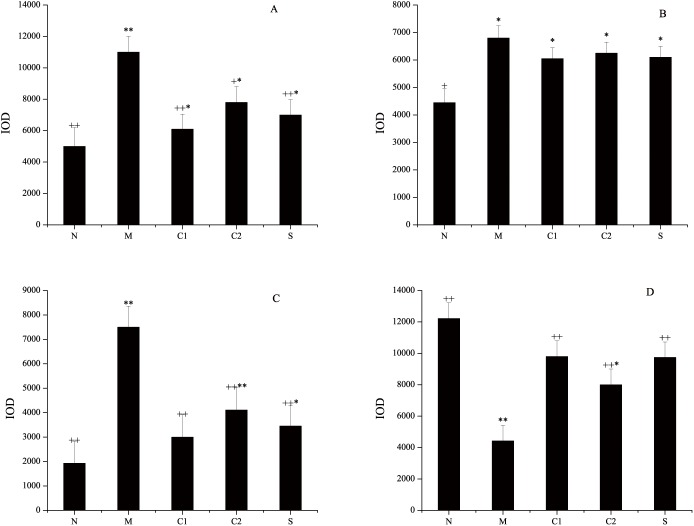
Fig 5. Expression levels of MEKK1 protein in the intestinal tissues of mice in the various groups.
On the 4th day of treatment with milk-derived CGMP, pathologically altered intestinal sections were removed and weighed. Total protein was extracted from these samples, and the protein concentration was assayed using the BCA method. The expression levels of MEKK1 in the intestinal mucosae of UC mice in the various groups were detected by Western blotting, and the results are shown in Fig 5A. The gray integration values for the corresponding protein bands were acquired with Quantity One analysis software. GAPDH was used as the internal reference for quantitative normalization of the target protein MEKK1. The relative gray integration values for MEKK1 levels in various groups of samples are shown in Fig 5B. N: normal control group; M: OXZ-model group; S: SASP-treated group; C1: CGMP group 1 (50 mg/kg bw•d); and C2: CGMP group 2 (200 mg/kg bw•d).* Indicates a significant difference compared with the normal control group (P < 0.05); ** indicates an extremely significant difference compared with the normal control group (P < 0.01); + indicates a significant difference compared with the model control group (P < 0.05); and ++ indicates an extremely significant difference compared with the model control group (P < 0.01).

