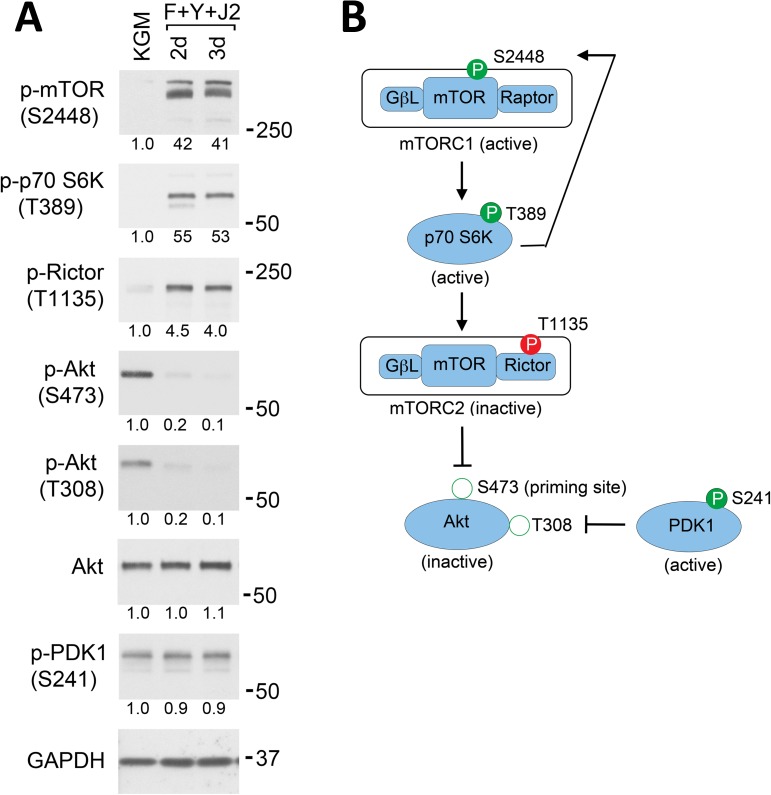
Fig 4. mTOR signaling inactivates Akt in CR HECs.
(A) Western blot analysis of the mTOR signaling pathway in CR HECs. Whole-cell lysates were prepared from 3 d cultures of HECs in KGM (KGM), or from 2–3 d CR cultures (F+Y+J2). Phosphorylation sites are indicated in parenthesis. Lanes contain equal amounts of protein. Molecular mass markers (in kDa) are shown on the right. (B) Diagram of mTORC1/Akt signaling in CR cells. Activating phosphorylation sites are shown as filled green circles and inhibitory phosphorylation sites as filled red circles. Phosphorylation of the mTORC1 complex at S2448 by p70 S6K is indicative of active mTORC1. Hollow green circles show activating sites on Akt that exhibit dramatically reduced phosphorylation in CR HECs.

