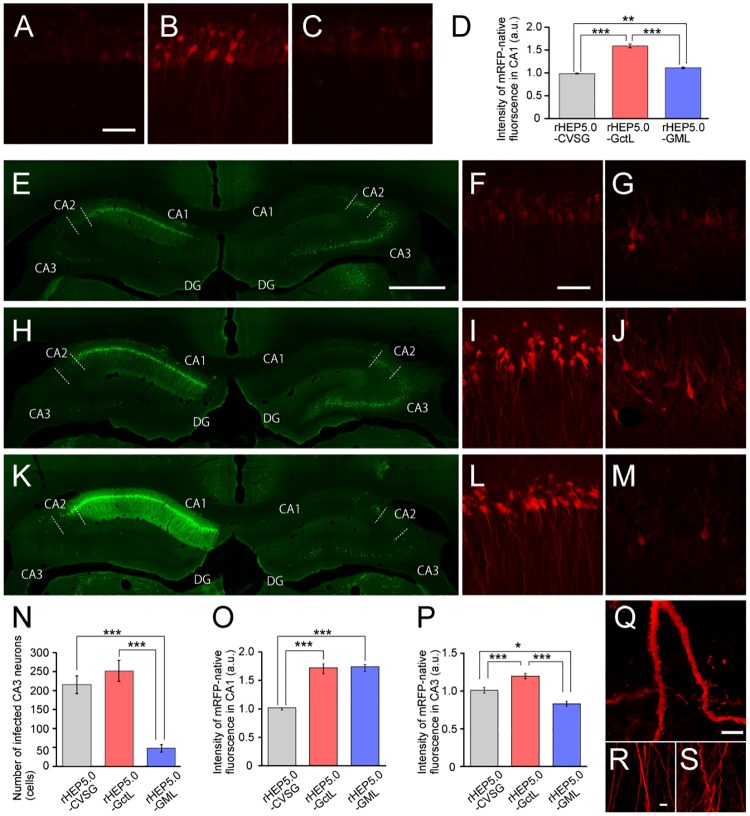
Fig 2. Characteristics of RV vectors in vivo.
A-C: Fluorescence photomicrographs demonstrating mRFP fluorescence of infected CA1 at 3 dpi of either rHEP-CVSG-mRFP (A), rHEP-GctL-mRFP (B), or rHEP-GML-mRFP (C) into MEC of left hemisphere. Scale bar = 50 μm in (A) [applies to (B) and (C)]. D: Fluorescence intensity of infected CA1 neurons [mean ± standard errors, number of analyzed cells: 129 (rHEP5.0-CVSG), 160 (rHEP5.0-GctL), and 149 (rHEP5.0-GML), *** p < 0.001, * p < 0.05]. E-M: Fluorescence photomicrographs demonstrating immunoreactivity against N protein in dorsal hippocampus (E, H, K) and mRFP fluorescence of infected CA1 (F, I, L) and contralateral CA3 neurons (G, J, M) at 6 dpi of either rHEP-CVSG-mRFP (E-G), rHEP-GctL-mRFP (H-J), or rHEP-GML-mRFP (K-M) into MEC of left hemisphere. CA3 (G, J, M) was imaged at higher laser power and optical gain than CA1 (F, I, L). Scale bar = 1000 μm in (E) [applies to (H) and (K)], 50 μm in (G) [applies to (G), (I), (J), (L), and (M)]. N: Number of infected neurons in CA3 per section [mean ± standard errors, number of analyzed sections: 6 (rHEP5.0-CVSG), 4 (rHEP5.0-GctL), and 6 (rHEP5.0-GML), *** p < 0.001]. O-P: Fluorescence intensity of infected CA1 (O) and CA3 (P) neurons [mean ± standard errors, number of analyzed cells: 346 (rHEP5.0-CVSG), 225 (rHEP5.0-GctL), and 234 (rHEP5.0-GML) for CA1; 48 (rHEP5.0-CVSG), 50 (rHEP5.0-GctL), and 19 (rHEP5.0-GML) for CA3, *** p < 0.001, * p < 0.05]. Q: High-magnification photomicrographs of rHEP-GctL-mRFP-infected neurons showing labeled dendritic spines. Scale bar = 5 μm. R-S: Apical dendrites of CA1 pyramidal neurons infected with rHEP-GctL-mRFP (R) and rHEP-GML-mRFP (R). Scale bar = 5 μm in (R) applies to (S).

