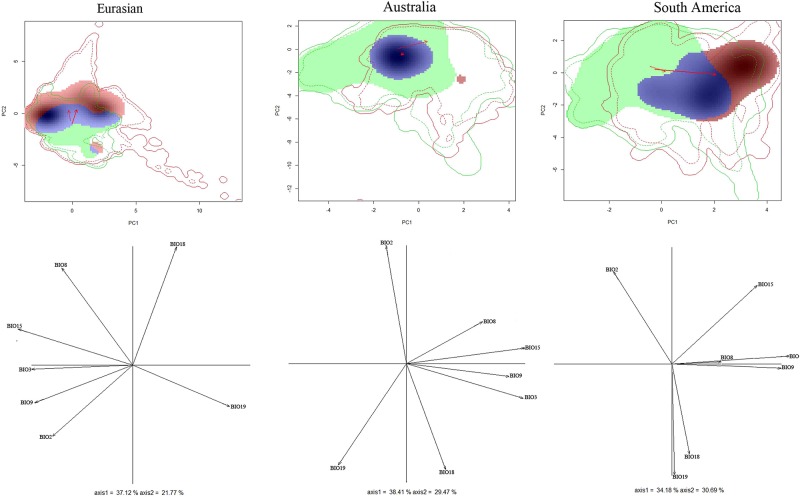
Fig 10. Native and invasive niches of P. solenopsis in different regions; multivariate climatic space was calculated using PCA-env method.
PC1 and PC2 represent the first two axes of the principal competent analysis (PCA). The green and red shadings represent density of species occurrences in different regions; blue represents overlap. Solid and dashed lines show 100% and 50% of the available (background) environment. The red arrows show how the center of the climatic niche for P. solenopsis (solid) and background extent (dotted) has moved between two ranges.

