Abstract
Two nanometre gold nanoparticles (AuNPs), bearing sugar moieties and/or thiol-polyethylene glycol-amine (PEG-amine), were synthesised and evaluated for their in vitro toxicity and ability to radiosensitise cells with 220 kV and 6 MV X-rays, using four cell lines representing normal and cancerous skin and breast tissues. Acute 3 h exposure of cells to AuNPs, bearing PEG-amine only or a 50:50 ratio of alpha-galactose derivative and PEG-amine resulted in selective uptake and toxicity towards cancer cells at unprecedentedly low nanomolar concentrations. Chemotoxicity was prevented by co-administration of N-acetyl cysteine antioxidant, or partially prevented by the caspase inhibitor Z-VAD-FMK. In addition to their intrinsic cancer-selective chemotoxicity, these AuNPs acted as radiosensitisers in combination with 220 kV or 6 MV X-rays. The ability of AuNPs bearing simple ligands to act as cancer-selective chemoradiosensitisers at low concentrations is a novel discovery that holds great promise in developing low-cost cancer nanotherapeutics.
Introduction
Radiotherapy is currently used in around half of all cancer treatments. Although generally effective, it is damaging to surrounding healthy tissues and needs to be improved by better targeting of cancer cells. One promising approach is to use nanoparticles composed of high atomic number elements, such as gold, hafnium, gadolinium, platinum or iron, which have large X-ray photon capture cross-sections, and can therefore locally increase the energy deposition near the nanoparticle through secondary electron emission from the nanoparticles [1–3]. Because of their biocompatibility and amenability to surface modification for tumour targeting, gold nanoparticles (AuNPs) have predominantly been used for tumour radiosensitisation studies [4–6]. AuNP radiosensitisation with external beam sources is more effective when using kilovoltage X-ray photons [7] than with megavoltage X-ray photons [4,8–10], although megavoltage is preferable due to its deeper tissue penetration.
The toxicity of AuNPs depends on their ligand shell, but in general they are non-toxic, except at high concentrations where they generate appreciable levels of reactive oxygen species (ROS) [11,12]. AuNPs smaller than 6 nm hydrodynamic diameter are preferable for therapeutic applications, since these can be excreted from the body by renal clearance, reducing long-term exposure to other organs [13,14].
Chemoradiosensitisers are dual-action drugs that are directly toxic to cells and also render the DNA more susceptible to radiation-induced damage. They include inhibitors of topoisomerase I, poly ADP-ribose polymerase (PARP), histone deacetylase (HDAC) and heat-shock protein 90 (Hsp90) [15]. However, current chemoradiosensitisers lack the ability to locally increase the deposited dose of radiation within cells. With that goal in mind, we have designed novel 2 nm gold core nanoparticles, coated with sugar ligands to improve aqueous solubility [16], and PEG-amine to improve biocompatibility [17] and cellular uptake [18]. Although originally envisaged as radiosensitising platforms to co-deliver anti-cancer drugs, these novel AuNPs were found to be selectively toxic for cancer cells at nanomolar concentrations and also act as radiosensitisers.
Materials and methods
Nanoparticle synthesis
Gold nanoparticles (AuNPs) with a mean gold core diameter of 2 nm were prepared by Midatech Ltd (Abingdon, UK) with different input ratios of HS-C2-sugar (α-galactose derivative, β-glucose derivative, or N-acetyl glucosamine derivative) and 1-amino-6-mercapto-hexaethyleneglycol (PEG-amine), as described previously [19]. Colloidal, citrate-capped AuNPs with a mean diameter of 2 nm were purchased from BBI Solutions (Cardiff, UK) and used with no further modification. All AuNP concentrations are quoted on the basis of Au content.
Nanoparticle physical characterisation
Transmission electron microscopy (TEM)
Nanoparticles were characterised by TEM imaging on electrostatically discharged carbon grids, using a JEM-1400 microscope (JEOL, USA) at an accelerating voltage of 80 kV and a magnification of x200,000. Nanoparticle size was measured from thresholded TEM images using ImageJ software.
Zeta potential
The charge of the nanoparticles (500 μg/ml) was measured in 3.2% PBS pH 7.4 using a zetasizer (Nano ZSP, Malvern instruments, using a DTS1070 cell).
Dynamic light scattering
The hydrodynamic size of the nanoparticles (100–400 μg/ml) was measured in water using a zetasizer (Nano ZSP, Malvern Instruments, using a DTS1070 cell).
1H-NMR
Three batches of nanoparticles with different input ratios of α-Gal and PEG-amine (25:75, 50:50, 75:25) were synthesised using 10 mg of Au and 3-fold molar excess of ligands.
Four mg of each AuNP were concentrated on 10 kDa cut-off ultrafiltration columns (Amicon) and then washed 3 times with 2 ml of D2O. AuNP samples were then transferred to a vial and resuspended in 400μl D2O containing 0.3 M KCN and 0.1 M KOH and incubated at 37.5°C overnight. Samples were then centrifuged at 13,000 x g for 1 min and analysed by 1H-NMR at 500 MHz (Avance III HD, Bruker), using MestReNova software. The defining protons for the α-Gal and PEG-amine ligands were identified to resonate at 4.95 ppm and 2.75 ppm respectively, these correspond to the single anomeric proton of α-galactose (NMR doublet) and the two CH2 protons proximal to the terminal NH2 bond in the PEG-amine linker (NMR triplet).
Cell culture
Four cell lines were used, representing normal and cancerous skin cells (HaCaT and HSC-3, respectively) as well as normal and cancerous breast cells (MCF-10 and MCF-7, respectively). HaCaT cells were a gift of Erik Walbeehm, Erasmus Medical Centre, Rotterdam. MCF-7 cells were a gift of Marilena Loizidou, University College London. MCF-10 cells were a gift of Kevin Prise, Queens University Belfast. HSC-3 cells were purchased from the American Type Culture Collection.
HSC-3, HaCaT and MCF-7 cells were grown in low glucose DMEM, supplemented with 10% FCS and 1% penicillin/streptomycin. MCF-10 cells were grown in DMEM/F12 without phenol red, supplemented with: 5% horse serum, 2.5 mM L-glutamine, 15 mM HEPES, 1 ng/ml cholera toxin, 10 μg/ml insulin, 50 μM hydrocortisone, 100 μM EGF and 1% pen/strep. All cells were maintained in T-75 culture flasks and passaged at 80% confluency.
Clonogenic assay
Cell proliferation and survival were quantified by clonogenic assay. Cells were seeded at between 300–2000 per well in 24 well culture plates and allowed to adhere for 24 h. Nanoparticles were added to the medium for 1, 3, 6 or 24 h, and then washed off once with medium. Cells were cultured for up to 6 days, changing medium every 2–3 days. Cells were then washed and stained with 10 mg/ml methylene blue in 50% ethanol. Colonies containing 50 cells or more were counted and colony formation expressed as a percentage of untreated controls. In some experiments, HSC-3 and HaCaT cells (3600 cells/ml) were loaded with AuNPs for 3 h in suspension culture in 15 ml Falcon tubes, resuspending the cells every 30 min. Cells were then washed twice by centrifugation and seeded at 300 cells per well for clonogenic assay, as described. The IC50 is defined as the concentration of AuNP resulting in 50% reduction in the number of cell colonies, compared with untreated controls. IC50 values were calculated from plots of the logarithm of AuNP concentration versus the percentage cell colonies, using GraphPad Prism 6.0.
Cellular uptake
Cellular uptake of AuNPs was assessed by TEM for sub-cellular localization, and quantitatively by inductively-coupled plasma mass spectrometry (ICP-MS).
Transmission electron microscopy (TEM)
HSC-3 and HaCaT cells were seeded onto 12 well transwell inserts overnight and then incubated for 3 h with 10 μg/ml AuNPs. This AuNP concentration was chosen in initial experiments, as it was the lowest concentration that gave good light microscopy staining of AuNPs in fixed cells, using a silver stain enhancement kit (R-Gent, Aurion). The cells were then fixed and silver enhanced to stain AuNPs and processed for TEM according to Gromnicova et al [20]. Ultrathin sections were analyzed using a JEM-1400 microscope with an accelerating voltage of 80 kV at magnifications of x2500 and x20,000.
Inductively coupled plasma mass spectrometry (ICP-MS)
HSC-3 and HaCaT cells (500,000 /ml) were incubated for 3 h with AuNPs at their HSC-3 IC50 concentration in suspension culture, resuspending the cells every 30 mins by gentle shaking. Cells were then washed twice with 5 ml medium by centrifugation and the cell density measured by haemocytometer. The cell pellet was dissolved in 2.5 ml of 3% tetramethylammonium hydroxide and 0.2% Triton X-100. Then, 2.5 ml of 1% HCl with iridium as internal standard was added prior to the ICP-MS analysis. The gold amount was calculated against a calibration curve ranging from 0.1 to 100 ng/ml of gold, including a blank (zero) point. Gold determination was performed using a Perkin-Elmer NexION 300X ICP-MS with a NexION ICP-MS software version 1.4.
Antioxidant cell protection assay
Adherent HSC-3 cells at 300 cell per well were incubated with AuNPs at their IC50 concentration for 3 h, with or without either 1 mM N-acetylcysteine or 0.1 mM sodium pyruvate antioxidants. Cells were washed and fresh medium was added with or without antioxidants. After 24 h, the medium was replaced without antioxidants and cells allowed to grow for a further 5 days. Cell colonies were counted and expressed as a percentage of untreated controls.
Caspase inhibition
HSC-3 and HaCaT cells were seeded at 300 cells/well for clonogenic assay. Some cells were pre-incubated for 1 h with 50 μM Z-VAD-FMK caspase inhibitor. Cells were then incubated for 3 h with either 1 μg/ml AuNPs, or with 10 μM Antimycin A to induce apoptosis. Cells were then washed and allowed to grow for 6 days. Cell colonies were counted and expressed as a percentage of untreated controls.
Cell-free hydroxyl radical assay
X-ray induced hydroxyl radical production was determined by the hydroxylation of coumarin-3-carboxylic acid (3-CCA) to fluorescent 7-hydroxycoumarin-3-carboxylic acid (7-OHCCA) [21,22]. A 5 mM stock solution of 3-CCA was prepared in 25 mM borate buffer of pH 9. Fifty μl aliquots of water, or 12 μg/ml AuNPs in water, were added to 50 μl 3-CCA in 96-well 3K molecular weight cutoff ultrafiltration plates (Acroprep Advance, Pall Corporation). Plates were irradiated with either 10 Gy of 6 MV X-rays at a dose rate of 5 Gy/min using a clinical linear accelerator (Versa HD, Elekta) at GenesisCare, Milton Keynes; or 10 Gy of 220 kV X-rays at a dose rate of 0.54 Gy/min using an Xstrahl 200 clinical orthovoltage system at Northampton Hospital. Control plates were not irradiated. Then, 100 μl ethanol was added per well to aid 7-OHCCA solubility; each plate was placed onto an empty receiving plate, and the nanoparticle-free filtrate was collected by centrifugation at 1500 x g. Quantification of 7-OHCCA fluorescence was performed with a FluoStar Optima plate reader (BMG Labtech). Excitation wavelength was set to 390 nm and maximum emission was detected at 450 nm [21].
Cell irradiations
Cells were seeded in 24 well culture plates at between 300–1800 cells/well and allowed to adhere overnight. Cells were incubated with AuNPs for 3 h at the cancer cell IC50 (HSC-3 IC50 for skin cells; MCF-7 IC50 for breast cells). Cultures were then irradiated with 2–8 Gy of either 220 kV or 6 MV X-rays, as detailed in the previous section. The 6 MV dose was deposited at the level of the cell layer by beam shaping and Solid Water shielding (Gammex). Control plates were transported to each facility but were not irradiated. Cell colonies were counted after 6 days and expressed as the surviving fraction (SF).
SF data were normalised for chemotoxicity by multiplying the SF data for each type of AuNP by 1/SF at 0 Gy. A linear-quadratic function was fitted to the normalized SF versus dose (D) data, of the form SF = -exp(αD+βD2).
Radiation enhancement effects are reported as two measurements from normalized SF data. The Sensitivity Enhancement Ratio (SER4Gy) is a measure of cell senescence or death enhancement by AuNPs at 4 Gy, calculated as the ratio of SF without and with AuNPs [23]. The Dose Enhancement Factor (DEF0.3) is a measure of the gain in effective radiation dose due to AuNPs, calculated as the ratio of the dose with radiation only to dose with radiation and AuNPs at a SF of 0.3.
Statistical analyses
Experiments were performed in triplicate. An unpaired t-test was used to compare two groups. To compare more than two groups, a one-way ANOVA was used with Bonferroni or Dunnett post-tests (GraphPad Prism 6.0 software).
Results
Physical characterisation of nanoparticles
The core size of the synthesised and citrate AuNPs was determined by TEM analysis, and demonstrated mean values between 1.7–2.4 nm, regardless of the ligands added during AuNP synthesis (Table 1, TEM images and histograms are shown in S1 Fig). Hydrodynamic diameters in water ranged from 4.5–6.6 nm, with no obvious link between ligand ratio and hydrodynamic size (Table 1). Except for the αGal-only AuNP and citrate AuNP, all of the AuNPs had a positive charge (Table 1). However, there was no obvious linear trend between zeta potential and sugar:PEG-amine ratio.
Table 1. AuNP physical characteristics.
| Sugar:PEG-amine ratio | TEM diameter (nm) | DLS diameter (nm) | Zeta potential (mV) |
|---|---|---|---|
| αGal:PEG-amine 0:100 | 1.82 ± 0.99 | 5.08 ± 3.31 | +43.0 ± 5.7 |
| αGal:PEG-amine 40:60 | 2.03 ± 0.58 | 4.45 ± 2.35 | +24.5 ± 7.2 |
| αGal:PEG-amine 50:50 | 1.78 ± 0.57 | 6.29 ± 2.17 | +45.4 ± 7.6 |
| αGal:PEG-amine 60:40 | 1.65 ± 0.50 | 5.27 ± 2.31 | +21.8 ± 5.7 |
| αGal:PEG-amine 100:0 | 1.96 ± 1.00 | 5.13 ± 1.28 | -16 ± 6.3 |
| βGlc:PEG-amine 50:50 | 2.41 ± 0.81 | 6.15 ± 1.76 | +24.1 ± 5.1 |
| GlcNAc:PEG-amine 50:50 | 2.13 ± 1.09 | 6.11 ± 1.59 | +30.9 ± 7.7 |
| Citrate AuNP | 2.04 ± 0.98 | 6.64 ± 2.17 | -45.1 ± 13.9 |
AuNP diameter from TEM measurements (±SD), hydrodynamic diameter from DLS measurements in water (±SD), and zeta potential measured in 3.2% PBS pH 7.4 (±SD).
1H-NMR analysis of three different αGal:PEG-amine AuNPs revealed a slight preference for PEG-amine over αGal for attachment to AuNPs during synthesis. Thus, an input ratio of 75:25 αGal:PEG-amine yielded AuNPs with an actual ratio of 68:32. An input ratio of 50:50 αGal:PEG-amine yielded AuNPs with an actual ratio of 39:61. An input ratio of 25:75 αGal:PEG-amine, yielded AuNPs with an actual ratio of 17:83 (S2 Fig).
AuNPs coated with sugar:PEG-amine are selectively toxic for skin cancer cells
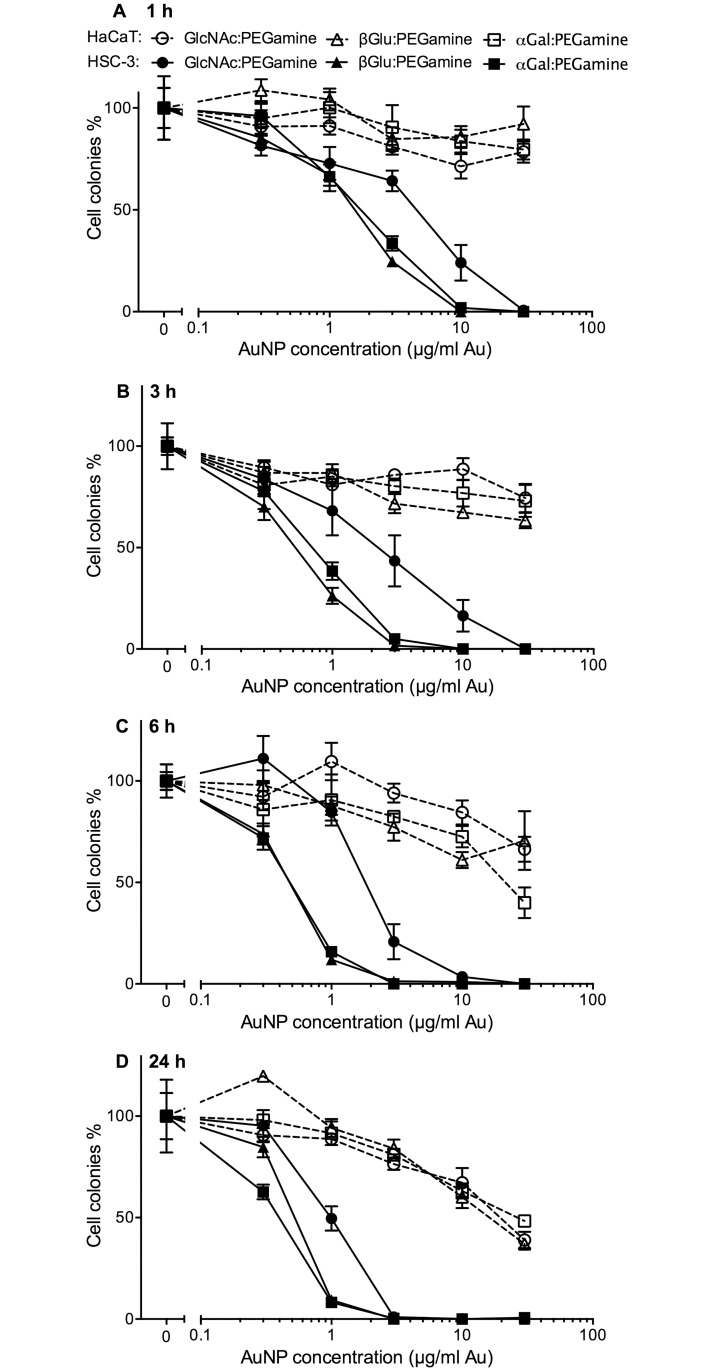
Initially, three AuNPs, each bearing PEG-amine, but with different sugar ligands, were characterised for toxicity with HSC-3 and HaCaT skin cells. These were αGal:PEG-amine (50:50), βGlc:PEG-amine (50:50) and GlcNAc:PEG-amine (50:50). Cells were exposed to between 0.3–30 μg/ml of each nanoparticle for 1, 3, 6, or 24 h and then cell proliferation and survival assessed by clonogenic assay (Fig 1).
Fig 1. Clonogenic assay dose-response curves for three different 50:50 sugar:PEG-amine AuNPs on adherent HSC-3 and HaCaT cells.
Cells were loaded with a range of AuNP concentrations for: A) 1 h, B) 3 h, C) 6 h and D) 24 h. The graphs represent the percentage of cell colonies compared to the no-nanoparticle control for each sugar:PEG-amine AuNP ±SEM.
Three observations can be made from these data: 1) All AuNPs selectively compromise the proliferation and survival of HSC-3 cancer cells, compared with HaCaT normal keratinocytes; HSC-3 cell proliferation and survival show 2) a concentration dependent and 3) incubation time dependent decrease.
AuNPs bearing either αGal or βGlc sugars demonstrated similar toxicities for HSC-3 cells, while AuNPs bearing GlcNAc were around 3–5 times less toxic. Because Midatech Pharma have tested αGal functionalised nanoparticles in Phase I and II clinical trials, and therefore plenty of data exist on their stability and biocompatibility, the αGal ligand was selected for subsequent work, using a 3 h incubation time.
The ratio of sugar:PEG-amine selectively affects cancer cell proliferation and survival
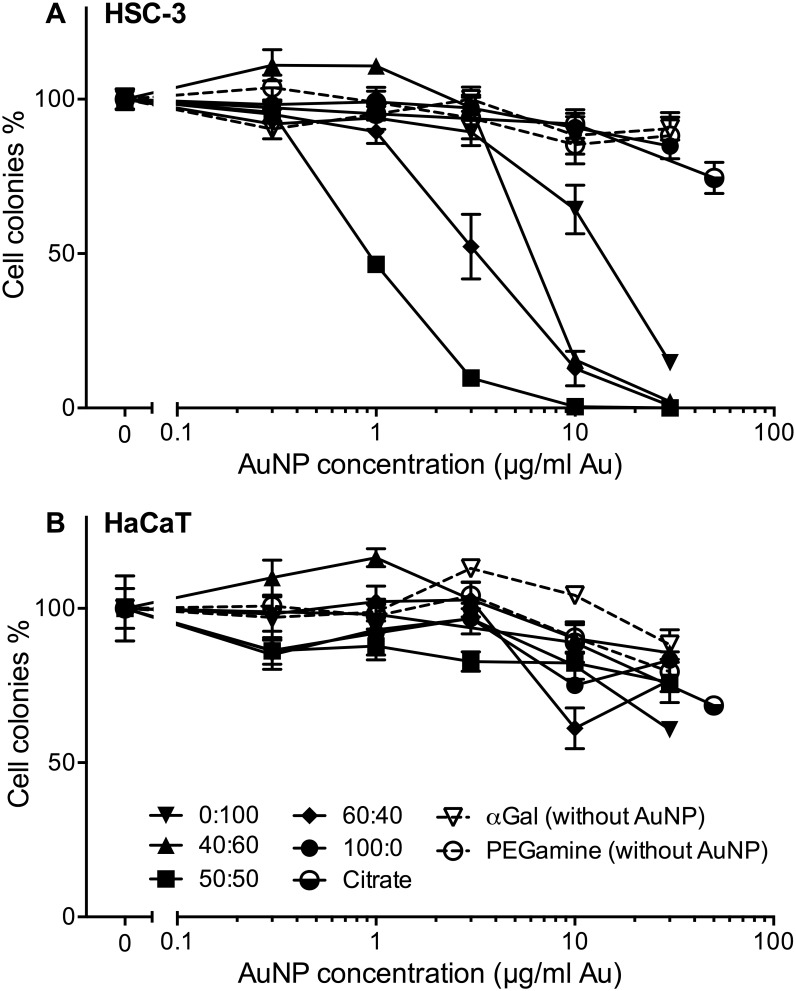
Having optimised the sugar ligand and loading time, the effect of different αGal:PEG-amine ratios on the toxicity of AuNP towards adherent HSC-3 cells and HaCaT cells, following 3 h exposure was investigated (Fig 2). Four different AuNP ratios demonstrated selective toxicity for HSC-3 cells (Fig 2A), while none of the AuNPs adversely affected HaCaT cell proliferation and survival up to 30 μg/ml gold content (Fig 2B). The greatest HSC-3 toxicities were observed respectively for: 50:50, 60:40, 40:60, and 0:100 αGal:PEG-amine ratios, whereas pure αGal AuNP (100:0) was not toxic. The αGal or PEG-amine ligands alone (without AuNP) were similarly not toxic. A citrate-capped AuNP was also not toxic. The HSC-3 IC50 values for the AuNPs, determined with cells loaded under adherent or suspension conditions, are presented in Table 2. Dose-toxicity graphs for suspension culture-loaded cells are presented in S3 Fig.
Fig 2. Clonogenic assay dose-response of different ratios of αGal:PEG-amine AuNPs, citrate-capped AuNPs, αGal only, or PEG-amine only, loaded for 3 h on adherent cells.
a) HSC-3 cells, b) HaCaT cells. The graphs represent the percentage of cell colonies compared to the no-nanoparticle control ±SEM.
Table 2. Chemotoxicity of different AuNPs.
| αGal:PEG-amine ratio |
HSC-3 IC50 adherent (μg/ml Au) |
HSC-3 IC50 suspension (μg/ml Au) |
|---|---|---|
| 100:0 | > 100 | >100 |
| 60:40 | 4.2 | 1.8 |
| 50:50 | 0.8 | 3.4 |
| 40:60 | 6.8 | 6.2 |
| 0:100 | 13 | 17.4 |
Clonogenic assay IC50 values for HSC-3 cells exposed to different αGal:PEG-amine AuNPs for 3 h under adherent or suspension culture conditions.
AuNP stability in culture medium
Four of the αGal:PEG-amine AuNPs were tested for their tendency to aggregate in DMEM culture medium plus 10% serum at AuNP concentrations of 10 μg/ml (a typical concentration that was used in cell culture). Of the four tested, the 0:100, 40:60 and 50:50 AuNPs did not demonstrate any aggregation, but the 100:0 AuNP did show aggregation (S4A–S4D Fig, respectively). In the absence of serum the AuNPs demonstrated pronounced aggregation (only shown for 50:50 AuNP in S4E Fig).
AuNP cellular accumulation is not directly related to toxicity
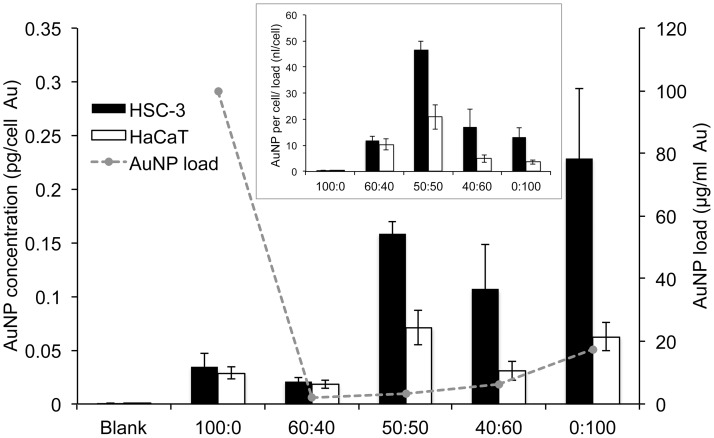
To determine if there was a correlation between AuNP cellular accumulation and toxicity, cells were loaded with different ratios of αGal:PEG-amine AuNPs for 3 h at equitoxic doses corresponding to their HSC-3 IC50 concentrations under suspension culture conditions. Cellular accumulation was then quantified by ICP-MS. Despite being loaded at equitoxic concentrations, large differences were observed in the accumulation of the different αGal:PEG-amine AuNPs in HSC-3 cells after 3 h (Fig 3). For instance, the αGal-only AuNP was loaded at the highest concentration in HSC-3 cells (100 μg/ml) and yet showed the lowest accumulation (0.03 pg/cell). Conversely, the PEG-amine-only (0:100) AuNP and 50:50 AuNP demonstrated the highest accumulation in HSC-3 cells (0.23 pg per cell and 0.16 pg per cell), and yet this was achieved at loading concentrations of only 17.4 μg/ml and 3.4 μg/ml, respectively.
Fig 3. Amount of gold per cell (left axis) in HSC-3 cells and HaCaT cells loaded with the HSC-3 IC50 (suspension culture) concentrations of different αGal:PEG-amine AuNPs for 3 h.
IC50 loading concentration (right axis) plotted as dotted line. Inset shows the same data re-plotted as gold per cell divided by AuNP loading concentration. All data are presented as mean value ± SEM.
Re-plotting the data to normalise for the amount of AuNP loaded, revealed a trend in which AuNP accumulation per cell was highest with 50:50 αGal:PEG-amine and gradually decreased either side of this maximum as the αGal:PEG-amine ratio increased or decreased (Fig 3 inset). Thus, although high AuNP accumulation may be directly related to toxicity with the 50:50 αGal:PEG-amine AuNP, the relationship between uptake and toxicity for the other αGal:PEG-amine ratios does not appear to be so straightforward. For instance, the loading concentrations (equivalent to the IC50 values) are similar for the 60:40 and 50:50 αGal:PEG-amine AuNPs. However, the amount of AuNP accumulated per cell is markedly higher with 50:50 αGal:PEG-amine AuNPs, making this AuNP of interest for radiosensitisation studies.
AuNPs accumulate in vesicles of cancer cells
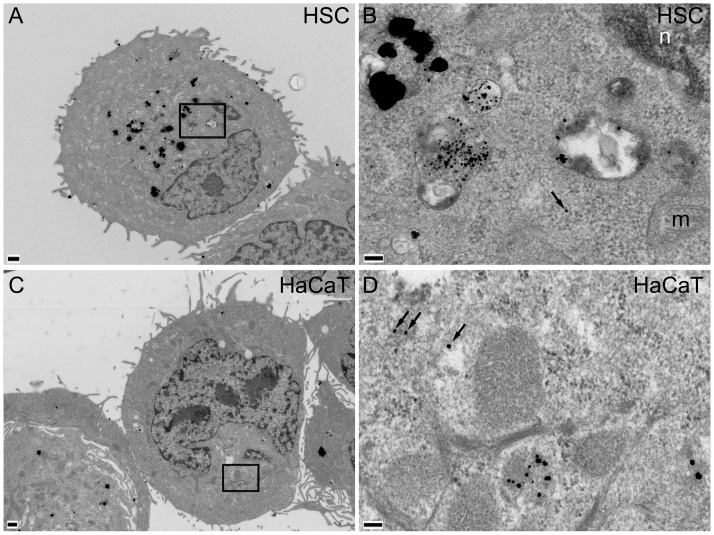
TEM was used to reveal details of AuNP intracellular localisation (Figs 4 and 5). HSC-3 and HaCaT cells were incubated with 10 μg/ml 50:50 (Fig 4) or 0:100 αGal:PEG-amine AuNPs (Fig 5) for 3 h. AuNPs accumulated in juxtanuclear vesicles that resemble lysosomes, with strong preferential accumulation in HSC-3 cells, compared with HaCaT cells, consistent with ICP-MS data (Fig 3). Isolated AuNPs were occasionally found within the cytoplasm, but were never seen in mitochondria or the nucleus (Fig 4B and 4D).
Fig 4. TEM images of A,B) HSC-3 and C,D) HaCaT cells incubated for 3 h with 10 μg/ml 50:50 αGal:PEG-amine AuNPs.
Boxed areas in A and C are magnified in B and D, respectively. Arrows indicate AuNPs within cytoplasm; n, nucleus; m, mitochondrion; scale bars A,C are 500 nm; B,D are 100 nm.
Fig 5. TEM images of A,B) HSC-3 and C,D) HaCaT cells incubated for 3 h with 10 μg/ml 0:100 αGal:PEG-amine AuNPs.
Boxed area in A is shown magnified in B. Scale bars A,C are 500 nm; B,D are 100 nm.
AuNP toxicity involves ROS and caspase-dependent cell death
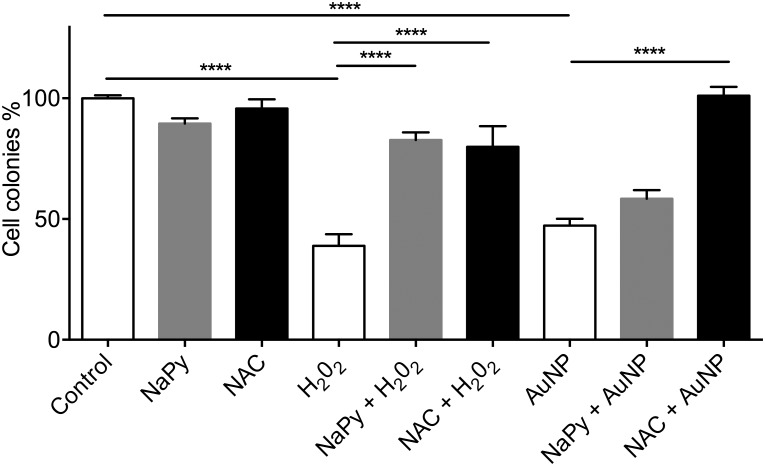
To determine whether ROS played a role in AuNP-mediated toxicity, HSC-3 cells were exposed to 1 μg/ml 50:50 αGal:PEG-amine AuNPs (chosen so as to be near the IC50 concentration) in the presence or absence of 0.1 mM sodium pyruvate or 1 mM N-acetyl cysteine antioxidants. N-acetylcysteine completely rescued the cells from AuNP-induced cell death, whilst sodium pyruvate gave a partial but not significant rescue of around 15% (Fig 6). Sodium pyruvate is known to scavenge extracellular ROS, but is poor at scavenging intracellular ROS [24], suggesting AuNPs being an intracellular source of ROS generation.
Fig 6. Clonogenic assay of HSC-3 cells exposed to 1 μg/ml 50:50 αGal:PEG-amine AuNPs in presence or in absence of 0.1 mM sodium pyruvate (NaPy) or 1 mM N-acetylcysteine (NAC) antioxidants.
For each condition, n = 3 and data are presented ±SEM. **** Denotes a significant difference (P<0.0001 ANOVA, Tukey multiple comparisons post-test).
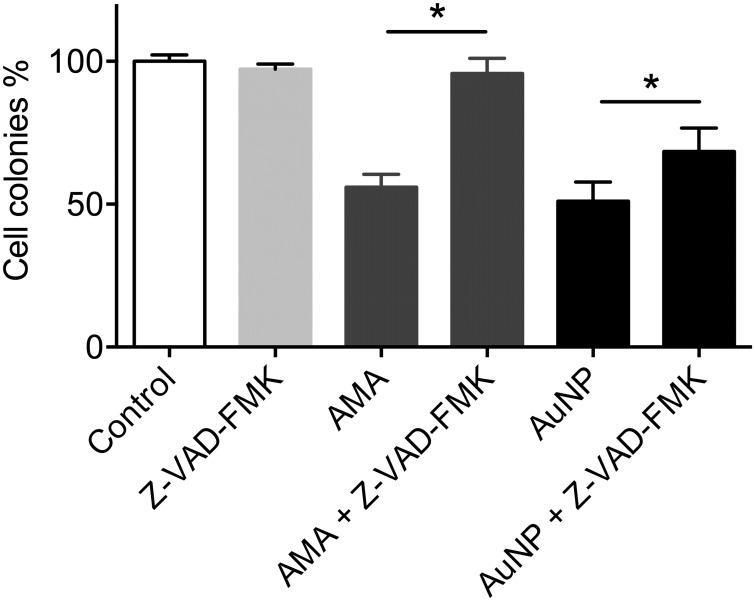
To determine whether apoptosis was involved in AuNP toxicity, cells were co-incubated with 1 μg/ml 50:50 αGal:PEG-amine AuNPs and the caspase 1/3 inhibitor Z-VAD-FMK (50 μM). Caspase inhibition resulted in a significant but incomplete rescue of AuNP-mediated cell death (Fig 7). By contrast, caspase inhibition gave a complete rescue of cell death using the apoptosis inducer, Antimycin A (10 μM) (Fig 7).
Fig 7. Clonogenic assay of HSC-3 cells, demonstrating a partial rescue of 50:50 αGal:PEG-amine AuNP-induced cell death by 50 μM Z-VAD-FMK caspase inhibitor.
10 μM Antimycin A was used as an apoptosis positive control. For each condition, n = 3 and data are presented ±SEM. * Denotes a significant difference (P<0.05 ANOVA, Tukey multiple comparisons post-test).
Evaluation of intrinsic AuNPs radiosensitisation potential
The presence of a ligand shell on the AuNPs can interfere with irradiation-induced electron release from the gold core, and thus lower the intrinsic radiosensitisation potential [25,26].
To investigate any such ligand shielding effect, a coumarin assay was used to examine irradiation-induced hydroxyl radical formation in cell-free aqueous solutions of AuNPs with different αGal:PEG-amine ligand shells, and citrate AuNPs that lack a thick ligand shell and therefore approach a ‘naked’ gold surface. A concentration of 6 μg/ml AuNPs was chosen for these experiments to maximize hydroxyl radical detection, since this was the highest AuNP concentration achievable with citrate-capped AuNPs (without resorting to filter concentration). Compared to water-only, 6 μg/ml citrate-capped 2 nm AuNPs (BBI) produced approximately 20% more 7-OHCCA fluorescence upon irradiation with 10 Gy of 6 MV X-rays. By contrast, radiation-induced 7-OHCCA production by 6 μg/ml 50:50 αGal:PEG-amine AuNPs was indistinguishable from that of water, while 6 μg/ml 0:100 αGal:PEG-amine AuNPs produced slightly less 7-OHCCA than water (Fig 8a). A similar trend was seen with 220 keV X-rays (Fig 8b). These data suggest that the 50:50 and 0:100 AuNPs would make poor radiosensitisers. However, ligand exchange by sulphur-containing proteins, such as glutathione, is known to occur on AuNPs [27], potentially allowing for sufficient reorganization of the αGal:PEG-amine ligand shell during intracellular processing to allow some radiosensitisation.
Fig 8. Hydroxyl radical formation assay of three different 6 μg/ml AuNP preparations in water with or without exposure to 10 Gy of A) 6 MV X-rays or B) 220 keV X-rays.
Significant differences in fluorescence of 7-OHCCA probe following irradiation, compared to irradiated water only are indicated as P<0.05 *, P<0.01 **, P<0.001 *** (ANOVA with Dunnett’s multiple comparisons post test).
Evaluation of AuNP biological radiosensitisation
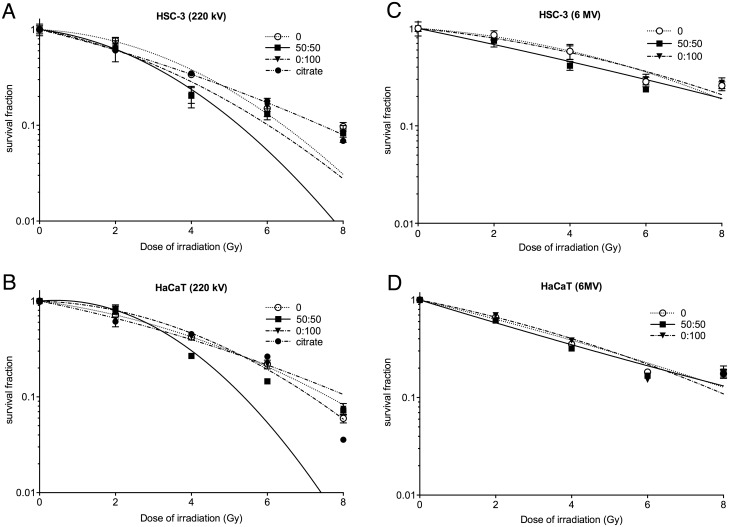
The 50:50 and 0:100 αGal:PEG-amine AuNPs demonstrated the highest cellular accumulation in HSC-3 cells (Fig 3) and were therefore selected for in vitro radiosensitisation experiments. HSC-3 and HaCaT cells were loaded with either 50:50 or 0:100 αGal:PEG-amine AuNPs at the HSC-3 IC50 for adherent cells (0.8 μg/ml for 50:50, 13 μg/ml for 0:100), or 1 μg/ml citrate-capped AuNPs (chosen to be near the HSC-3 IC50 concentration) for 3 h and then irradiated with doses of 2 to 8 Gy of either 220 kV X-rays or 6 MV X-rays. A linear-quadratic function was applied to the normalised SF data, which gave a good fit up to around 4 Gy, after which the slope deviated from linear-quadratic to become linear again (Fig 9). For this reason analyses of SEF were made at 4 Gy, while DEF was calculated at a survival fraction of 0.3 (DEF0.3), which in most cases also corresponded to around 4 Gy with AuNPs (Table 3). Radiosensitisation was increased in the presence of 50:50 αGal:PEG-amine AuNPs at both kV and MV energies (Fig 9, Table 3). However, the 0:100 αGal:PEG-amine AuNP was a poor radiosensitiser at kV energies and was slightly radioprotective at MV energies, compared to controls without AuNPs (Fig 9, Table 3), in keeping with the intrinsic radiosensitisation data (Fig 8).
Fig 9. Normalised survival fractions of (A,C) HSC-3 and (B,D) HaCaT cells following exposure to αGal:PEG-amine AuNPs at their HSC-3 IC50 concentrations, followed by different doses of (A,B) 220 kV X-rays or (C.D) 6 MV X-rays.
Data are presented as the mean survival fraction ±SEM. A linear-quadratic curve was fitted to each data series.
Table 3. Sensitivity Enhancement Ratios and Dose Enhancement Factors calculated for skin cells.
| Cell line (AuNP) | SER4Gy 6 MV |
SER4Gy 220 kV |
DEF0.3 6 MV Dose 0/ Dose NP |
DEF0.3 220 kV Dose 0/ Dose NP |
|---|---|---|---|---|
| HSC-3 (50:50) | 1.40 | 1.73 | 6.59/5.98 = 1.10 | 5.46/3.60 = 1.52 |
| HSC-3 (0:100) | 1.02 | 1.63 | 6.59/6.73 = 0.98 | 4.52/3.89 = 1.16 |
| HSC-3 (citrate) | N/D | 0.97 | N/D | 4.52/4.39 = 1.03 |
| HaCaT (50:50) | 1.10 | 1.08 | 4.97/4.22 = 1.18 | 5.61/4.02 = 1.40 |
| HaCaT (0:100) | 0.91 | 0.99 | 4.97/5.01 = 0.99 | 5.02/5.08 = 0.99 |
| HaCaT (citrate) | N/D | 0.93 | N/D | 5.02/4.95 = 1.01 |
AuNPs are selectively chemotherapeutic to breast cancer cells
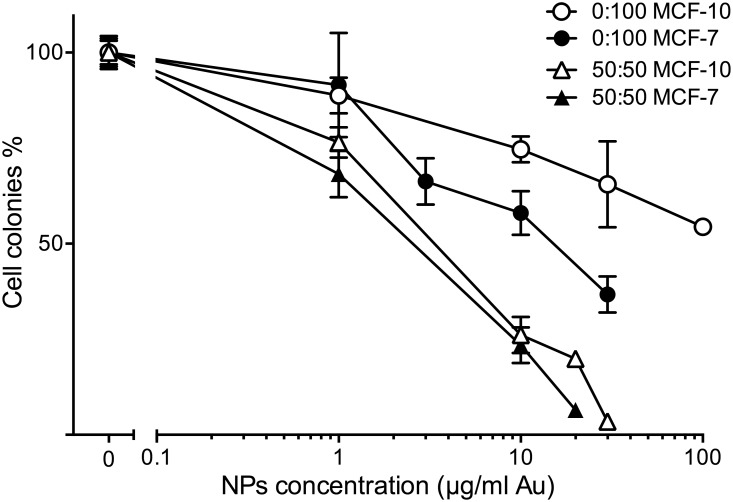
Because 50:50 αGal:PEG-amine AuNPs demonstrated radiosensitisation with skin cancer cells, we investigated whether breast cells also demonstrated chemotoxicity and radiosensitistion with AuNPs. MCF-7 breast cancer cells and MCF-10 normal breast cells were loaded for 3 h with different concentrations of either 50:50 or 0:100 αGal:PEG-amine AuNPs under adherent conditions (Fig 10). For both AuNPs, toxicity was greater for MCF7 cells than with MCF-10 cells, although selectivity towards cancer cells was better with 0:100 αGal:PEG-amine AuNPs. The IC50 values for MCF-7 cells were 2.5 μg/ml for the 50:50 αGal:PEG-amine AuNP and 15 μg/ml for the 0:100 αGal:PEG-amine AuNP (Fig 10).
Fig 10. Clonogenic assay dose-response of adherent MCF-7 and MCF-10 cells exposed for 3 h to different concentrations of 50:50 or 0:100 αGal:PEG-amine AuNPs.
The graphs represent the percentage of cell colonies compared to the no-nanoparticle control ±SEM.
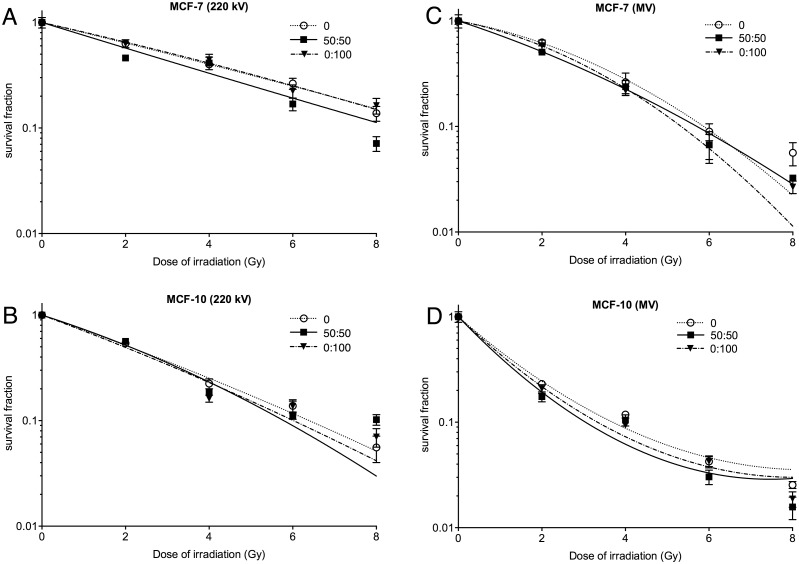
To determine whether αGal:PEG-amine AuNPs radiosensitise breast cells, MCF-7 and MCF-10 cells were incubated for 3 h with the MCF-7 IC50 concentrations of αGal:PEG-amine AuNPs prior to irradiation with 2–8 Gy of either 220 keV X-rays or 6 MV X-rays. Clonogenic assay demonstrated radiosensitisation with 50:50 αGal:PEG-amine AuNPs, but negligible radiosensitisation with 0:100 αGal:PEG-amine AuNP (Fig 11, Table 4). Neither AuNP radiosensitised breast cells to the extent seen with skin cells.
Fig 11. Clonogenic assay of (A,B) MCF-7 and (C,D) MCF-10 cells following exposure to αGal:PEG-amine AuNPs at their MCF-7 IC50 concentrations, then different doses of A,C) 220 kV X-rays or B,D) 6 MV X-rays.
Table 4. Sensitivity Enhancement Ratios and Dose Enhancement Factors calculated for breast cells.
| Cell line (AuNP) | SER4Gy 6 MV |
SER4Gy 220 kV |
DEF0.3 6 MV Dose 0/ Dose NP |
DEF0.3 220 kV Dose 0/ Dose NP |
|---|---|---|---|---|
| MCF7 (50:50) | 1.11 | 0.97 | 3.85/3.34 = 1.15 | 5.22/4.35 = 1.20 |
| MCF7 (0:100) | 1.21 | 0.90 | 3.85/3.50 = 1.10 | 5.22/5.30 = 0.99 |
| MCF10 (50:50) | 1.12 | 1.20 | 1.67/1.40 = 1.20 | 3.53/3.40 = 1.04 |
| MCF10 (0:100) | 1.27 | 1.39 | 1.67/1.53 = 1.10 | 3.53/3.32 = 1.06 |
Discussion
Current efforts to improve radiotherapy aim to either locally increase the radiation dose within the tumour or to magnify the effects of radiation damage by preventing cellular repair in tumour cells. From a practical viewpoint, an ideal treatment would combine both of these abilities in a single chemoradiosensitiser. Towards that goal, we find that AuNPs synthesised with specific ratios of sugar derivative and PEG-amine ligands are selectively toxic to skin cancer cells, with an IC50 of 0.8 μg/ml for the 50:50 αGal:PEG-amine AuNPs, and also act as radiosensitisers. Models calculate that a 1.96 nm AuNP contains 225 atoms [28], sitting between the measured values of 144 Au atoms for 1.68 nm AuNPs [29] and 333 Au atoms for 2.2 nm AuNPs [30]. Accordingly, we estimate that each 50:50 αGal:PEG-amine AuNP (mean diameter of 1.78 nm) contains around 180 Au atoms, making the HSC-3 IC50 concentration of 0.8 μg/ml gold equivalent to approximately 23 nM AuNP. These IC50 concentrations are the lowest we have found among published data for simple AuNPs that do not bear toxin ligands (ranging between 100 nM to 100 μM [12]). Importantly, we achieve these toxicities after only 3 h acute exposure to αGal:PEG-amine AuNPs, whereas most other studies report incubating cells with AuNPs for between 24–48 h [10,11,18,31–34].
Few studies have explored the selective toxicity of AuNPs for cancer cells. For instance, Patra et al [34] found selective chemotoxicity of 30 nm citrate-capped AuNPs towards A549 lung cancer cells after 48 h continuous exposure (IC50 100 nM), but no effect on HepG2 liver cancer cells. Butterworth et al [35] demonstrated a decreased proliferation rate following exposure of DU145 cells (but not MDA231-MB cells) to 10 μg/ml 1.9 nm AuroVist AuNPs. Exposure of these AuNP-loaded cells to 160 kV X-rays did not lead to appreciable radiosensitisation with DU145 cells (SER2Gy 0.98), but did radiosensitise MDA231-MB cells (SER2Gy 1.67), indicating their AuNPs were not dual chemoradiotherapeutic [35]. Changes in ligand organisation on AuNPs affect cell membrane interactions and thereby change the rate of cellular uptake [32,36]. We find that changes in the ratio of αGal:PEG-amine ligands dramatically affect the uptake and toxicity of AuNPs, with the highest uptake and toxicity seen with the 50:50 αGal:PEG-amine AuNPs.
Except for the 0:100 αGal:PEG-amine AuNPs, AuNP uptake per cell (inset in Fig 3) tends to be directly related to positive zeta potential (Table 1), although no relationship is apparent between uptake per cell and DLS diameter (Table 1). In serum-containing medium, the 0:100 and 50:50 αGal:PEG-amine AuNPs do not aggregate (S4 Fig) and remain as individual AuNPs when taken up into cells (Figs 4 and 5), except when they become highly concentrated within some lysosomes (Fig 4B). In contrast, 100:0 αGal:PEG-amine AuNPs do aggregate in serum-containing medium (S4E Fig), perhaps explaining their poor cellular uptake (Fig 3) and low toxicity (Table 2). Work is ongoing to unravel the mechanisms of selective cellular uptake and toxicity.
The mechanism of cell death with the 50:50 αGal:PEG-amine AuNPs involves elevated ROS and caspase-3 activation. This could imply interactions of AuNPs with mitochondria. However, AuNPs were not observed on or within mitochondria 3 h after AuNP loading, suggesting either an indirect or delayed interaction with these organelles. Several studies demonstrate ROS-mediated AuNP chemotoxicity, but this is generally seen in the continual presence of micromolar concentrations of AuNPs for 24 h [33,37].
Previous studies have demonstrated that adding a polyethylene glycol coating [38–40] or glucose coating to AuNPs [41,42] improves cellular uptake and radiosensitisation. It was reported that 15 nM glucose-coated AuNPs with 200 kV X-rays gave a 24 h SER2Gy of 1.56 [41], while at 6 MV, 5 nM glucose-coated AuNPs gave a clonogenic SER2.5Gy of 1.02 [42]. In both these cases, AuNPs were incubated with cells for 24 h. In a similar approach to ours, Zhu [43] compared the cytotoxicity and radiosensitisation of 20–30 nm AuNPs co-functionalized with galactose and polyethylene glycol, to citrate-capped AuNPs. They found no difference in chemotoxicity between these AuNPs with HepG2 cells following 24 h exposure (IC50 5 μg/ml). However, their galactose-polyethylene glycol-AuNPs demonstrated a better radiosensitisation than citrate AuNPs (DEF0.37 of 1.95 versus 1.46). In contrast, we find that with HSC-3 cells, 50:50 αGal:PEG-amine AuNPs are more chemotoxic than citrate AuNPs (IC50 0.8 μg/ml versus >50 μg/ml) and demonstrate better radiosensitisation (DEF0.3 1.52 versus 1.03). Dense ligand coatings on AuNPs decrease irradiation-induced radical formation in cell-free assays [25,26], leading to the conclusion that improved radiosensitisation is likely due to a sufficiently increased cellular uptake of AuNPs, that outweighs their lower intrinsic irradiation-induced radical formation ability. We had hoped that by using short, hexameric, ethylene glycol chains, we could largely circumvent the ligand-dependent decrease in intrinsic radiosensitisation ability. However, we found that even these short ligand chains render the AuNPs no better than water in cell-free radiation-induced radical formation assays. Nevertheless, the observation of radiosensitisation in cells suggests that the ligand shell may become sufficiently modified in vitro to allow a proportion of secondary electrons to escape the nanoparticle surface and take part in radical production. This, in combination with the high chemotoxicity of these AuNPs and ease of synthesis, make them an excellent starting point for the rational design of further improvements to this novel chemoradiosensitiser platform.
Supporting information
Size distribution histograms of AuNPs, measured from TEM images, plus representative TEM images for each AuNP. Scale bar is 20 nm.
(TIF)
The input synthesis ratio and output actual ratio of αGal:PEG-amine were compared for three different AuNPs. A) a 75:25 αGal:PEG-amine mixture yielded an actual AuNP ratio of 68:32. B) a 50:50 αGal:PEG-amine mixture yielded an actual AuNP ratio of 39:61. C) a 25:75 αGal:PEG-amine mixture yielded an actual AuNP ratio of 17:83.
(TIF)
Clonogenic assay dose-response of different ratios of αGal:PEG-amine AuNPs loaded for 3 h under suspension culture conditions a) HSC-3 cells, b) HaCaT cells. The graphs represent the percentage of cell colonies compared to the no-nanoparticle control ±SEM.
(TIFF)
A-D) Different ratios of αGal:PEG-amine AuNPs were incubated for 3 h with DMEM culture medium containing 10% serum and were then imaged by TEM (scale bars are 20 nm). E) 50:50 αGal:PEG-amine AuNPs were incubated for 3 h with serum-free DMEM and were then imaged by TEM (scale bar is 2000 nm).
(TIF)
Excel spreadsheet containing all raw data.
(XLSX)
Acknowledgments
ICP-MS analyses were performed by Ibon Perera, Julen Barrenetxea and Eduardo Nieva at Midatech Pharma España SLU, Building 800, Ibaizabal Bidea S/N, Parque Tecnológico Bizkaia, Derio, 48160, Spain. 1H-NMR analyses were performed by Cristina Espinosa Garcia at Midatech Pharma, Abingdon, UK. We thank Igor Kraev and Radka Gromnicova at the Open University for assistance with TEM.
Data Availability
All relevant data are within the paper and its Supporting Information files.
Funding Statement
Funding was provided by the European Union FP7-PEOPLE Initial Training Network “ARGENT – Advanced Radiotherapy, Generated by Exploiting Nanoprocesses and Technologies” Project ID 608163 http://itn-argent.eu. The funder provided support in the form of salary for SG, but did not have any additional role in the study design, data collection and analysis, decision to publish, or preparation of the manuscript. MR and PW are employees of Midatech Pharma. AS and RS-C are employees of GenesisCare. Neither of these companies provided financial support for this project. However, both companies were asked for their permission to publish. The specific roles of each author are articulated in the ‘author contributions’ section.
References
- 1.Kwatra D, Venugopal A, Anant S. Nanoparticles in radiation therapy: a summary of various approaches to enhance radiosensitization in cancer. Transl Cancer Res. 2013;2: 330–342. [Google Scholar]
- 2.Pottier A, Borghi E, Levy L. The future of nanosized radiation enhancers. Br J Radiol. British Institute of Radiology; 2015;88: 20150171 doi: 10.1259/bjr.20150171 [DOI] [PMC free article] [PubMed] [Google Scholar]
- 3.McMahon SJ, Paganetti H, Prise KM. Optimising element choice for nanoparticle radiosensitisers. Nanoscale. 2016; doi: 10.1039/C5NR07089A [DOI] [PubMed] [Google Scholar]
- 4.McMahon SJ, Hyland WB, Muir MF, Coulter JA, Jain S, Butterworth KT, et al. Biological consequences of nanoscale energy deposition near irradiated heavy atom nanoparticles. Sci Rep. Nature Publishing Group; 2011;1: 18 doi: 10.1038/srep00018 [DOI] [PMC free article] [PubMed] [Google Scholar]
- 5.Hainfeld JF, Dilmanian FA, Slatkin DN, Smilowitz HM. Radiotherapy enhancement with gold nanoparticles. J Pharm Pharmacol. Blackwell Publishing Ltd; 2008;60: 977–985. doi: 10.1211/jpp.60.8.0005 [DOI] [PubMed] [Google Scholar]
- 6.Hainfeld JF, Dilmanian FA, Zhong Z, Slatkin DN, Kalef-Ezra JA, Smilowitz HM. Gold nanoparticles enhance the radiation therapy of a murine squamous cell carcinoma. Phys Med Biol. IOP Publishing; 2010;55: 3045–3059. doi: 10.1088/0031-9155/55/11/004 [DOI] [PubMed] [Google Scholar]
- 7.Rahman WN, Bishara N, Ackerly T, He CF, Jackson P, Wong C, et al. Enhancement of radiation effects by gold nanoparticles for superficial radiation therapy. Nanomedicine Nanotechnology, Biol Med. 2009;5: 136–142. doi: 10.1016/j.nano.2009.01.014 [DOI] [PubMed] [Google Scholar]
- 8.Berbeco RI, Ngwa W, Makrigiorgos GM. Localized Dose Enhancement to Tumor Blood Vessel Endothelial Cells via Megavoltage X-rays and Targeted Gold Nanoparticles: New Potential for External Beam Radiotherapy. Int J Radiat Oncol. 2011;81: 270–276. doi: 10.1016/j.ijrobp.2010.10.022 [DOI] [PubMed] [Google Scholar]
- 9.Jain S, Coulter JA, Hounsell AR, Butterworth KT, McMahon SJ, Hyland WB, et al. Cell-specific radiosensitization by gold nanoparticles at megavoltage radiation energies. Int J Radiat Oncol Biol Phys. Elsevier; 2011;79: 531–9. doi: 10.1016/j.ijrobp.2010.08.044 [DOI] [PMC free article] [PubMed] [Google Scholar]
- 10.Hau H, Khanal D, Rogers L, Suchowerska N, Kumar R, Sridhar S, et al. Dose enhancement and cytotoxicity of gold nanoparticles in colon cancer cells when irradiated with kilo- and mega-voltage radiation. Bioeng Transl Med. 2016;1: 94–102. doi: 10.1002/btm2.10007 [DOI] [PMC free article] [PubMed] [Google Scholar]
- 11.Fratoddi I, Venditti I, Cametti C, Russo MV. How toxic are gold nanoparticles? The state-of-the-art. Nano Res. Tsinghua University Press; 2015;8: 1771–1799. doi: 10.1007/s12274-014-0697-3 [Google Scholar]
- 12.Haume K, Rosa S, Grellet S, Śmiałek MA, Butterworth KT, Solov’yov A V., et al. Gold nanoparticles for cancer radiotherapy: a review. Cancer Nanotechnol. Springer Vienna; 2016;7: 8 doi: 10.1186/s12645-016-0021-x [DOI] [PMC free article] [PubMed] [Google Scholar]
- 13.Alric C, Miladi I, Kryza D, Taleb J, Lux F, Bazzi R, et al. The biodistribution of gold nanoparticles designed for renal clearance. Nanoscale. The Royal Society of Chemistry; 2013;5: 5930 doi: 10.1039/c3nr00012e [DOI] [PubMed] [Google Scholar]
- 14.Sancey L, Lux F, Kotb S, Roux S, Dufort S, Bianchi A, et al. The use of theranostic gadolinium-based nanoprobes to improve radiotherapy efficacy. Br J Radiol. British Institute of Radiology; 2014;87: 20140134 doi: 10.1259/bjr.20140134 [DOI] [PMC free article] [PubMed] [Google Scholar]
- 15.Page P, Yang L-X. Novel chemoradiosensitizers for cancer therapy. Anticancer Res. International Institute of Anticancer Research; 2010;30: 3675–82. Available: http://www.ncbi.nlm.nih.gov/pubmed/20944153 [PubMed] [Google Scholar]
- 16.Irure A, Marradi M, Arnáiz B, Genicio N, Padro D, Penadés S. Sugar/gadolinium-loaded gold nanoparticles for labelling and imaging cells by magnetic resonance imaging. Biomater Sci. The Royal Society of Chemistry; 2013;1: 658 doi: 10.1039/c3bm60032g [DOI] [PubMed] [Google Scholar]
- 17.Jokerst J V, Lobovkina T, Zare RN, Gambhir SS. Nanoparticle PEGylation for imaging and therapy. Nanomedicine (Lond). NIH Public Access; 2011;6: 715–28. doi: 10.2217/nnm.11.19 [DOI] [PMC free article] [PubMed] [Google Scholar]
- 18.Chhour P, Kim J, Benardo B, Tovar A, Mian S, Litt HI, et al. Effect of Gold Nanoparticle Size and Coating on Labeling Monocytes for CT Tracking. Bioconjug Chem. American Chemical Society; 2017;28: 260–269. doi: 10.1021/acs.bioconjchem.6b00566 [DOI] [PMC free article] [PubMed] [Google Scholar]
- 19.Lund T, Callaghan MF, Williams P, Turmaine M, Bachmann C, Rademacher T, et al. The influence of ligand organization on the rate of uptake of gold nanoparticles by colorectal cancer cells. Biomaterials. 2011;32: 9776–9784. doi: 10.1016/j.biomaterials.2011.09.018 [DOI] [PubMed] [Google Scholar]
- 20.Gromnicova R, Davies HA, Sreekanthreddy P, Romero IA, Lund T, Roitt IM, et al. Glucose-Coated Gold Nanoparticles Transfer across Human Brain Endothelium and Enter Astrocytes In Vitro. Kano MR, editor. PLoS One. Public Library of Science; 2013;8: e81043 doi: 10.1371/journal.pone.0081043 [DOI] [PMC free article] [PubMed] [Google Scholar]
- 21.Collins AK, Makrigiorgos GM, Svensson GK. Coumarin chemical dosimeter for radiation therapy. Med Phys. American Association of Physicists in Medicine; 1994;21: 1741–1747. doi: 10.1118/1.597275 [DOI] [PubMed] [Google Scholar]
- 22.Manevich Y, Held KD, Biaglow JE. Coumarin-3-Carboxylic Acid as a Detector for Hydroxyl Radicals Generated Chemically and by Gamma Radiation. Radiat Res. 1997;148: 580 doi: 10.2307/3579734 [PubMed] [Google Scholar]
- 23.Luchette M, Korideck H, Makrigiorgos M, Tillement O, Berbeco R. Radiation dose enhancement of gadolinium-based AGuIX nanoparticles on HeLa cells. Nanomedicine Nanotechnology, Biol Med. 2014;10: 1751–1755. doi: 10.1016/j.nano.2014.06.004 [DOI] [PubMed] [Google Scholar]
- 24.Kelts JL, Cali JJ, Duellman SJ, Shultz J. Altered cytotoxicity of ROS-inducing compounds by sodium pyruvate in cell culture medium depends on the location of ROS generation. Springerplus. Springer International Publishing; 2015;4: 269 doi: 10.1186/s40064-015-1063-y [DOI] [PMC free article] [PubMed] [Google Scholar]
- 25.Xiao F, Zheng Y, Cloutier P, He Y, Hunting D, Sanche L. On the role of low-energy electrons in the radiosensitization of DNA by gold nanoparticles. Nanotechnology. IOP Publishing; 2011;22: 465101 doi: 10.1088/0957-4484/22/46/465101 [DOI] [PMC free article] [PubMed] [Google Scholar]
- 26.Gilles M, Brun E, Sicard-Roselli C. Gold nanoparticles functionalization notably decreases radiosensitization through hydroxyl radical production under ionizing radiation. Colloids Surfaces B Biointerfaces. 2014;123: 770–777. doi: 10.1016/j.colsurfb.2014.10.028 [DOI] [PubMed] [Google Scholar]
- 27.Hong R, Han G, Fernández JM, Kim B, Forbes NS, Rotello VM. Glutathione-Mediated Delivery and Release Using Monolayer Protected Nanoparticle Carriers. American Chemical Society; 2006; doi: 10.1021/JA056726I [DOI] [PubMed] [Google Scholar]
- 28.Hostetler MJ, Wingate JE, Zhong C-J, Harris JE, Vachet RW, Clark MR, et al. Alkanethiolate Gold Cluster Molecules with Core Diameters from 1.5 to 5.2 nm: Core and Monolayer Properties as a Function of Core Size. American Chemical Society; 1998; doi: 10.1021/LA970588W [Google Scholar]
- 29.Schaaff GT, Shafigullin MN, Khoury JT, Vezmar I, Whetten RL. Properties of a Ubiquitous 29 kDa Au:SR Cluster Compound. American Chemical Society; 2001; doi: 10.1021/JP011122W [Google Scholar]
- 30.Qian H, Zhu Y, Jin R. Atomically precise gold nanocrystal molecules with surface plasmon resonance. Proc Natl Acad Sci U S A. National Academy of Sciences; 2012;109: 696–700. doi: 10.1073/pnas.1115307109 [DOI] [PMC free article] [PubMed] [Google Scholar]
- 31.Khoshgard K, Hashemi B, Arbabi A, Rasaee MJ, Soleimani M. Radiosensitization effect of folate-conjugated gold nanoparticles on HeLa cancer cells under orthovoltage superficial radiotherapy techniques. Phys Med Biol. IOP Publishing; 2014;59: 2249–2263. doi: 10.1088/0031-9155/59/9/2249 [DOI] [PubMed] [Google Scholar]
- 32.Beddoes CM, Case CP, Briscoe WH. Understanding nanoparticle cellular entry: A physicochemical perspective. Adv Colloid Interface Sci. 2015;218: 48–68. doi: 10.1016/j.cis.2015.01.007 [DOI] [PubMed] [Google Scholar]
- 33.Chompoosor A, Saha K, Ghosh PS, Macarthy DJ, Miranda OR, Zhu Z-J, et al. The Role of Surface Functionality on Acute Cytotoxicity, ROS Generation and DNA Damage by Cationic Gold Nanoparticles. Small. WILEY‐VCH Verlag; 2010;6: 2246–2249. doi: 10.1002/smll.201000463 [DOI] [PMC free article] [PubMed] [Google Scholar]
- 34.Patra HK, Banerjee S, Chaudhuri U, Lahiri P, Dasgupta AK. Cell selective response to gold nanoparticles. Nanomedicine. Elsevier; 2007;3: 111–9. doi: 10.1016/j.nano.2007.03.005 [DOI] [PubMed] [Google Scholar]
- 35.Butterworth KT, Coulter JA, Jain S, Forker J, McMahon SJ, Schettino G, et al. Evaluation of cytotoxicity and radiation enhancement using 1.9 nm gold particles: potential application for cancer therapy. Nanotechnology. Europe PMC Funders; 2010;21: 295101 doi: 10.1088/0957-4484/21/29/295101 [DOI] [PMC free article] [PubMed] [Google Scholar]
- 36.Chithrani BD, Stewart J, Allen C, Jaffray DA. Intracellular uptake, transport, and processing of nanostructures in cancer cells. Nanomedicine Nanotechnology, Biol Med. 2009;5: 118–127. doi: 10.1016/j.nano.2009.01.008 [DOI] [PubMed] [Google Scholar]
- 37.Lee K, Lee H, Lee KW, Park TG. Optical imaging of intracellular reactive oxygen species for the assessment of the cytotoxicity of nanoparticles. Biomaterials. 2011;32: 2556–2565. doi: 10.1016/j.biomaterials.2010.11.072 [DOI] [PubMed] [Google Scholar]
- 38.Liu C-J, Wang C-H, Chien C-C, Yang T-Y, Chen S-T, Leng W-H, et al. Enhanced x-ray irradiation-induced cancer cell damage by gold nanoparticles treated by a new synthesis method of polyethylene glycol modification. Nanotechnology. IOP Publishing; 2008;19: 295104 doi: 10.1088/0957-4484/19/29/295104 [DOI] [PubMed] [Google Scholar]
- 39.Liu C-J, Wang C-H, Chen S-T, Chen H-H, Leng W-H, Chien C-C, et al. Enhancement of cell radiation sensitivity by pegylated gold nanoparticles. Phys Med Biol. IOP Publishing; 2010;55: 931–945. doi: 10.1088/0031-9155/55/4/002 [DOI] [PubMed] [Google Scholar]
- 40.Zhang X-D, Wu D, Shen X, Chen J, Sun Y-M, Liu P-X, et al. Size-dependent radiosensitization of PEG-coated gold nanoparticles for cancer radiation therapy. Biomaterials. 2012;33: 6408–6419. doi: 10.1016/j.biomaterials.2012.05.047 [DOI] [PubMed] [Google Scholar]
- 41.Zhang X, Xing JZ, Chen J, Ko L, Amanie J, Gulavita S, et al. Enhanced radiation sensitivity in prostate cancer by gold-nanoparticles. Clin Investig Med. 2008;31: 160–167. [DOI] [PubMed] [Google Scholar]
- 42.Geng F, Song K, Xing JZ, Yuan C, Yan S, Yang Q, et al. Thio-glucose bound gold nanoparticles enhance radio-cytotoxic targeting of ovarian cancer. Nanotechnology. IOP Publishing; 2011;22: 285101 doi: 10.1088/0957-4484/22/28/285101 [DOI] [PubMed] [Google Scholar]
- 43.Zhu C, Zheng Q, Wang L, Xu H-F, Tong J, Zhang Q, et al. Synthesis of novel galactose functionalized gold nanoparticles and its radiosensitizing mechanism. J Nanobiotechnology. BioMed Central; 2015;13: 67 doi: 10.1186/s12951-015-0129-x [DOI] [PMC free article] [PubMed] [Google Scholar]
Associated Data
This section collects any data citations, data availability statements, or supplementary materials included in this article.
Supplementary Materials
Size distribution histograms of AuNPs, measured from TEM images, plus representative TEM images for each AuNP. Scale bar is 20 nm.
(TIF)
The input synthesis ratio and output actual ratio of αGal:PEG-amine were compared for three different AuNPs. A) a 75:25 αGal:PEG-amine mixture yielded an actual AuNP ratio of 68:32. B) a 50:50 αGal:PEG-amine mixture yielded an actual AuNP ratio of 39:61. C) a 25:75 αGal:PEG-amine mixture yielded an actual AuNP ratio of 17:83.
(TIF)
Clonogenic assay dose-response of different ratios of αGal:PEG-amine AuNPs loaded for 3 h under suspension culture conditions a) HSC-3 cells, b) HaCaT cells. The graphs represent the percentage of cell colonies compared to the no-nanoparticle control ±SEM.
(TIFF)
A-D) Different ratios of αGal:PEG-amine AuNPs were incubated for 3 h with DMEM culture medium containing 10% serum and were then imaged by TEM (scale bars are 20 nm). E) 50:50 αGal:PEG-amine AuNPs were incubated for 3 h with serum-free DMEM and were then imaged by TEM (scale bar is 2000 nm).
(TIF)
Excel spreadsheet containing all raw data.
(XLSX)
Data Availability Statement
All relevant data are within the paper and its Supporting Information files.


