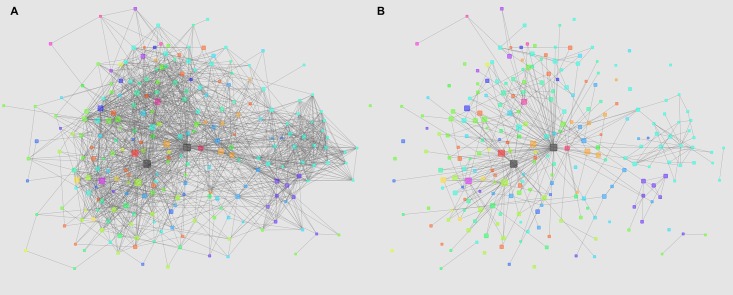
Fig 3. Sparsity of Bayesian direct morbidity maps of multimorbidities over the diseasome.
Figure A shows the network of disorders based on χ2 independence tests whereas figure B represents the sparser BDMM of the same disorders. The node color denotes the different high level ICD-10 categories of the different disorders. The node size is proportional to the prevalence of the diseases. The two gray nodes with multiple connections are sex and age.

