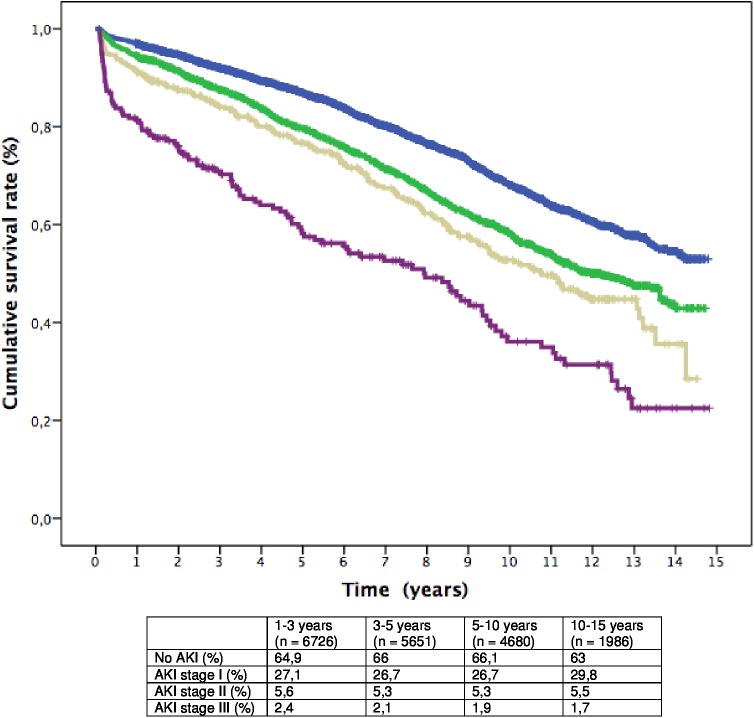
Fig 2. Kaplan-Meier cumulative survival curves from 30 days after surgery to 15 years follow-up.
(Blue: patients without AKI; Green: patients who developed AKI stage I; Yellow: patients who developed AKI stage II; Purple: patients who developed AKI stage III); p< 0.0001. The table shows the percent distribution of patients in each period between groups (p = NS).

