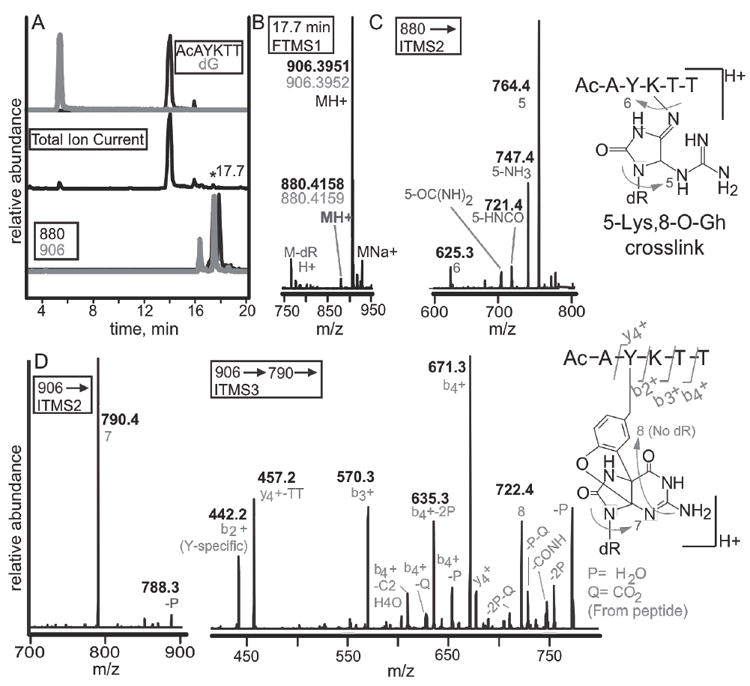
Figure 8. LC-MS identification of rose bengal oxidized adduct between dG and the peptide N-Ac-AYKTT.

(A) A peptide containing both a tyrosine and lysine were reacted with 2’-deoxyguanosine. Selected ion chromatograms from the reaction are shown. The top two chromatograms are N-acetyl-AYKTT (black) and 2’-deoxyguanosine (grey). The total ion chromatogram (middle) shows the starting materials as the most abundant ions. Monitoring of ions with masses of 880 (black) and 906 (grey) show several peaks eluting within one minute (bottom). (B) Analysis of the 17.7-minute peak shows masses of 880.4158 and 906.3951. Experimental masses are in black while theoretical masses are in grey. (C) MS2 analysis of the 880 peak show that the lesion is guanidinohydantoin. (D) The 906 peak can either be a lysine-spiroiminodihydantoin or a tyrosine-guanine crosslink. The b2+ ion bisects the tyrosine and lysine revealing that tyrosine is modified.
