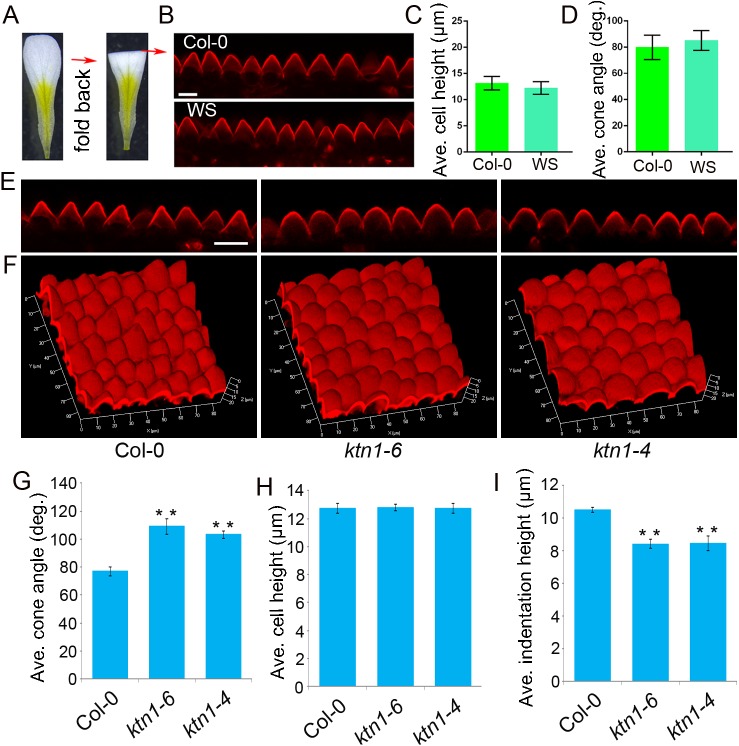
Fig 1. Developing an approach to quantify the geometry of conical cells with a confocal laser scanning microscope.
(A) Schematic flowchart showing the folding back of a petal to expose the interface. A. thaliana petals are folded back to allow for the side view of conical cells at the folding position under a microscope. (B) Confocal images of conical cells from stage 14 petals of A. thaliana (Col-0 and WS). The side visualization of conical cells from the propidium iodide-stained folded petals by Zeiss LSM 880 confocal. Scale bar = 10μm. (C and D) Quantitative analyses of the geometry of conical cells. Cell heights (C) and cone angles (D) were quantified from confocal images. Values are given as the mean ± SD of more than 300 cells of 6 petals from independent plants. (E) Confocal images of petal conical cells of wild type, the ktn1-6 mutant (the EMS mutant line), and the ktn1-4 mutant (the T-DNA mutant line). Scale bar = 20μm. (F) 3D reconstruction of conical cells from wild type, ktn1-6, and ktn1-4. Z stacks of confocal images of PI-stained non-folded petals (stage 14) were taken from the top view along their Z axis at steps of 0.8 μm to reconstruct 3D images. (G–I) Quantitative analyses of conical cells from wild type, ktn1-6, and ktn1-4. Confocal images of conical cells from stage 14 petals of wild type and ktn mutants were used for quantification. Quantitative analysis showed that conical cells of the ktn mutants displayed a significant increase in cone angles (G) and decrease in indentation heights (I) compared with the wild type. Asterisk indicates a significant difference(student t-test, **P<0.01)between the data sets from ktn1-6 and ktn1-4 compared with Col-0 (P = 0.000472, P = 0.000736, respectively). Quantitative analysis of cell heights (H) showed that there were no significant differences between Col-0 and the ktn mutants (student t-test, P = 0.740, P = 0.920). Values are given as the mean ± SD of more than 300 cells of 6 petals from independent plants.

