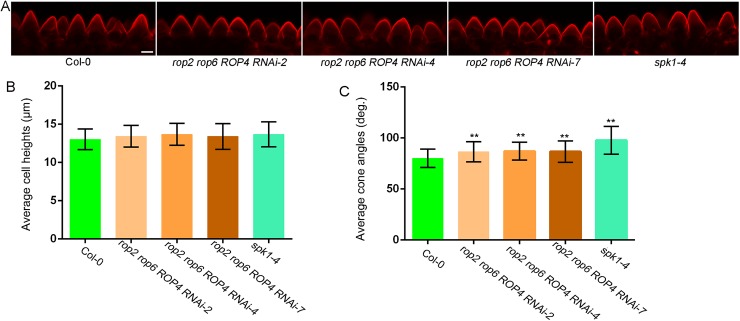
Fig 3. Phenotype analysis of the rop2 rop6 ROP4RNAi lines and the spk1-4 mutant.
(A) Representative confocal images of conical cells from stage 14 petals of wild type (Col-0), the rop2 rop6 ROP4 RNAi lines, and the spk1-4 mutant. Scale bar = 10μm. (B and C) Quantitative analyses of conical cells from wild type, the rop2 rop6 ROP4 RNAi lines, and the spk1-4 mutant. Confocal images of conical cells were used for quantification. For quantitative analyses of cone angles, two-way ANOVA followed by Sidak's multiple comparison test indicated a significant difference (**P<0.01) between the data sets from the rop2 rop6 ROP4 RNAi lines and the spk1-4 mutant, compared with Col-0 (P = 0.00236, P = 0.0046, P = 0.00863, and P = 0.0000273, respectively). Values are given as the mean ± SD of more than 300 cells of 6 petals from independent plants.

