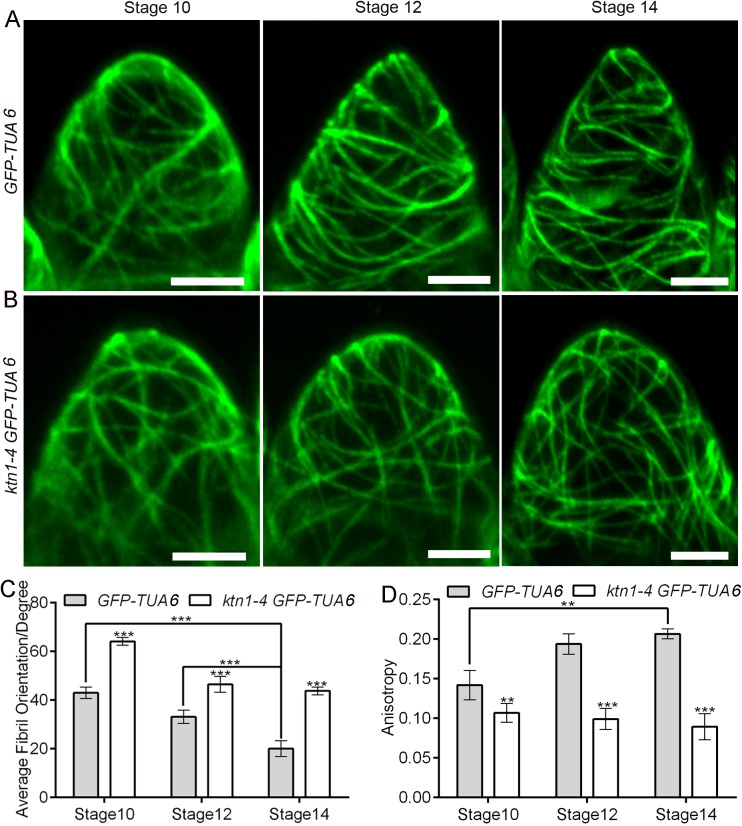
Fig 4. Visualization of microtubules in the serrated geometry of conical cells in wild type and ktn1-4.
(A and B)Representative confocal images showing arrangement in the serrated geometry of conical cells from folded petals of wild type and the ktn1-4 mutant stably expressing GFP-TUA6. Surface projections of confocal images from the adaxial epidermis of folded petals from wild type and ktn1-4 at the indicated developmental stages. At development stage 10, wild-type cells exhibited random orientation of microtubule arrays, while at later development stages, microtubules of wild-type cells were reoriented into well-ordered transverse arrays. In contrast, the ktn1-4 mutant cells displayed random microtubules arrays throughout petal development stages. Scale bars = 5μm. (C and D) Quantitative analyses of the average orientation and anisotropy of microtubules in wild-type and ktn1-4 conical cells. FribrilTool, an ImageJ plug-in, was used for quantification of the orientation angle (Average Fibril Orientation) and the anisotropy of microtubules in a given region of interest. Anisotropy values range from 0 to 1. 0 indicates pure isotropy, and 1 represents pure anisotropy. For quantitative analyses of the average fibril orientation (C), two-way analysis of variance (ANOVA) followed by Sidak's multiple comparison test indicated a significant difference (***P<0.001)between the data sets from stage 10 and stage 12 GFP-TUA6 line compared with stage 14GFP-TUA6 line (P = 0.0000042 and P = 0.0000273, respectively), and between the data sets from GFP-TUA6 line compared with the ktn1-4 GFP-TUA6 line (for stage 10, P = 0.000013, for stage 12, P = 0.00023, for stage14, P = 0.0000227).For quantitative analyses of the anisotropy of microtubules (D), two-way ANOVA followed by Sidak's multiple comparison test indicated a significant difference (**P<0.01 and ***P<0.001)between the data sets from stage 10 GFP-TUA6 line compared with stage 14 GFP-TUA6 line (P = 0.00268), and between the data sets from GFP-TUA6 line compared with the ktn1-4 GFP-TUA6 line (for stage 10, P = 0.00128, for stage 12, P = 0.000004227, for stage14, P = 0.00000458).Values are given as the mean ± SD of more than 50 cells of 6 petals from independent plants.

