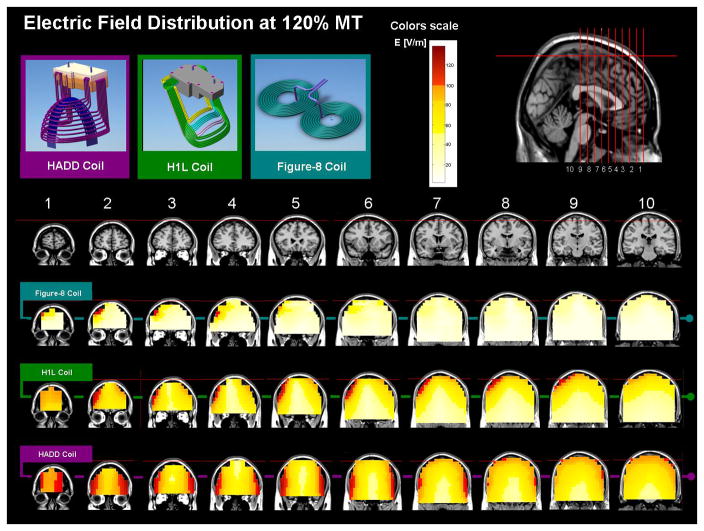
Fig. 9.
Maps of the electric field induced by three coils placed over the prefrontal cortex. The maps represent phantom brain measurements of the absolute electric field induced at each pixel. The red colors indicate field magnitude above the threshold for neuronal activation, which was set to 100 V/m. The field maps are adjusted for stimulator output required to obtain 120% of the threshold (120 V/m), at a depth of 1.5 cm. a. Field maps of a standard figure-8 coil. b. Field maps of the H1L coil, which was designed to activate lateral prefrontal regions in the left hemisphere. c. Field maps of the HAAD coil, which was designed to activate deep bilateral prefrontal regions.

