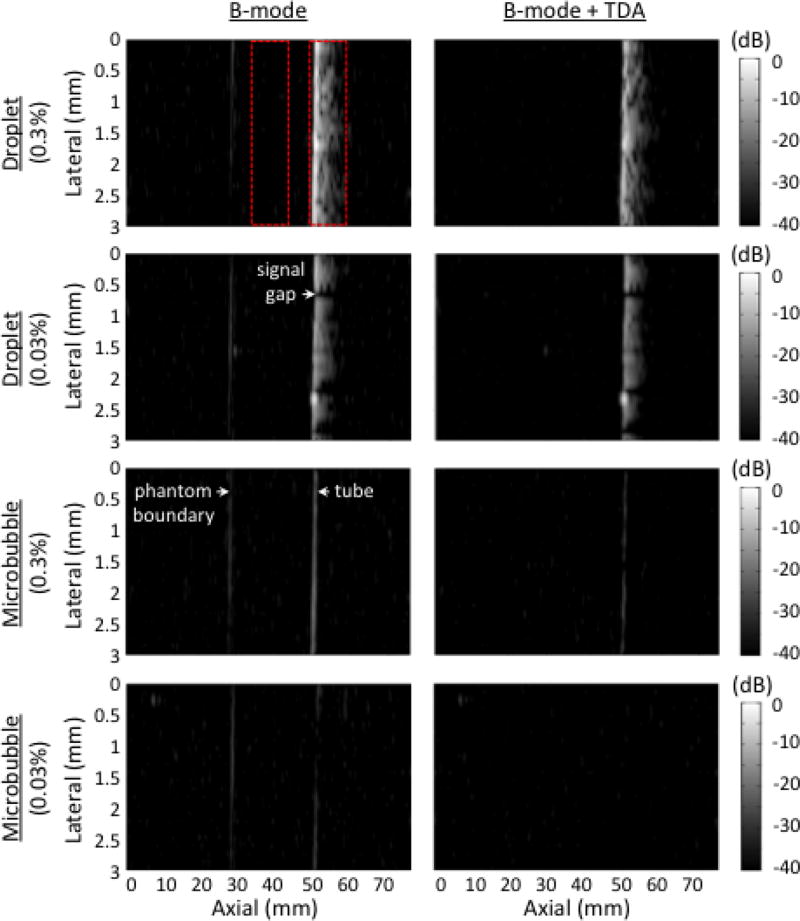
Fig. 3.
B-mode images of various contrast agents infused through the tissue-mimicking phantom. Different concentrations are presented before (left) and after (right) time-domain averaging, TDA. The pressure at the focus was 700 kPa. At that pressure, it was possible to see linear reflections from the water-phantom boundary before TDA. The dynamic range is 40 decibels, dB. Images were normalized to the 0.3% droplet trial pre-TDA. The red dotted areas indicated regions of interest for CTR calculations.

