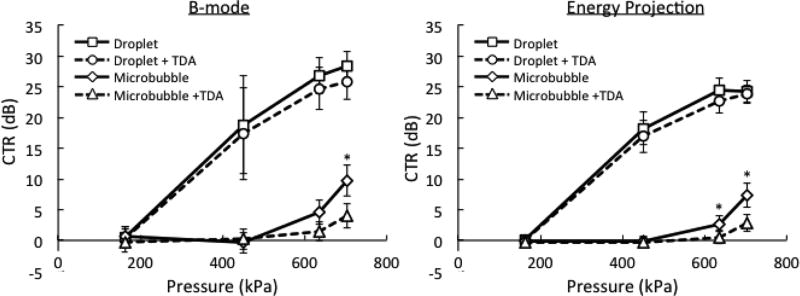
Fig. 6.
Contrast-to-tissue ratio (CTR) for B-mode and energy projection (EP) images as a function of contrast agent formulation and applied pressure. The effects of time-domain averaging (TDA) are shown by the dotted lines. The contrast agent concentration is 0.3%. The error bars indicate one standard deviation. The asterisks denote a significant effect of TDA within droplet or microbubble groups (p < 0.05).

