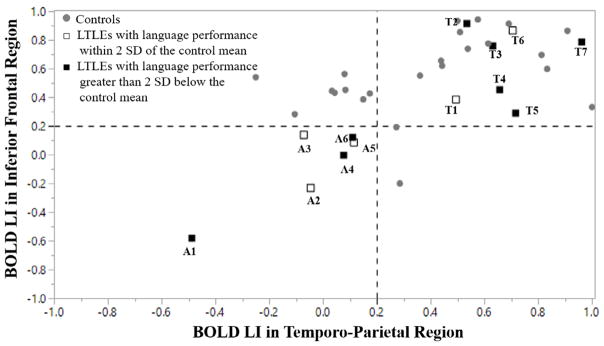
Figure 2.
The plot for atypical (A) and typical (T) language dominance in both controls and patients with LTLE. The lower left quadrant indicates atypical language dominance. The empty square indicates that patient’s language performance was greater than 2 standard deviations below of the mean in the control group, whereas the solid square indicates that patient’ language performance was less than 2 standard deviations below the mean of the control.

