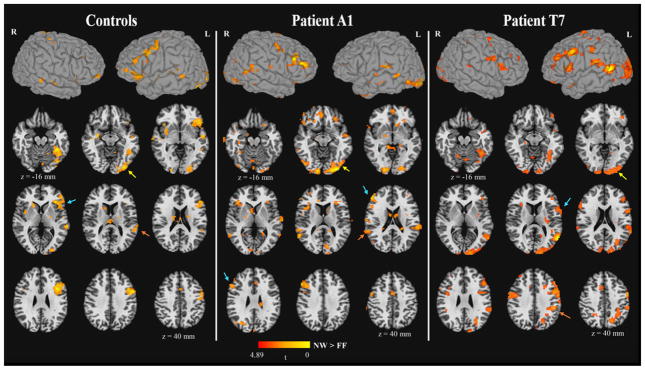
Figure 3.
The fMRI activation maps2 for the contrast of NW > FF in the control group, Patient A1, and Patient T7. The activation in the inferior frontal, temporo-parietal, and temporo-occipital regions were indicated by the cyan, orange, yellow arrows, respectively. The z coordinate was presented in Talairach space. p < .01, cluster size > 25 voxels, corrected α < .05.

