
Figure 4.
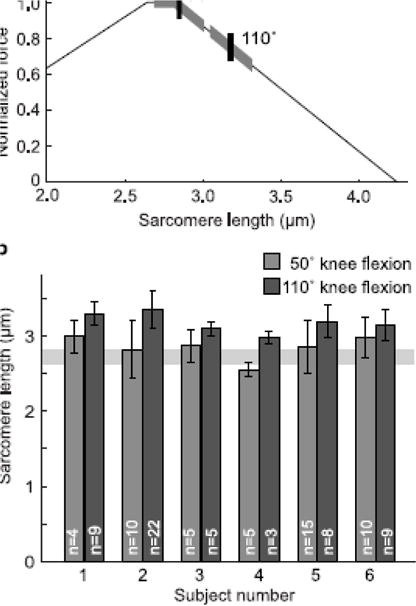
Sarcomere lengths in the vastus lateralis at 50° and 110° of knee flexion. a) Mean (vertical tick) and standard deviation (thick highlighting on curve) of sarcomere lengths measured in n = 6 subjects in the vastus laterals at 50° and 110° of knee flexion, plotted with a theoretical force-length curve as described by Gollapudi and Lin (2009). b) Mean sarcomere lengths of the vastus lateralis in each of 6 subjects at 50° and 110° of knee flexion. Standard deviation error bars show the variation among multiple (n = 3–22) fibers within each subject. The shaded horizontal region represents the plateau of the force-length curve.