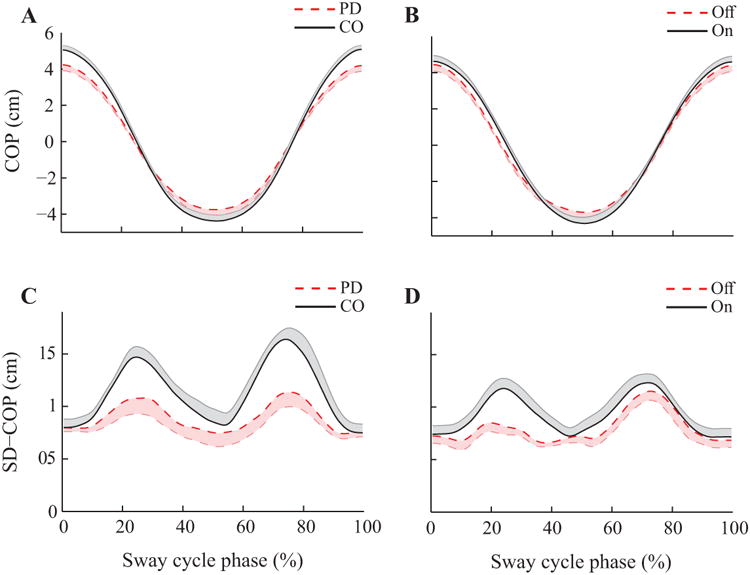
Figure 3.

Time-normalized profiles of the center of pressure coordinate in the anterior-posterior direction (COPAP; A and B) and the standard deviation of COPAP (SD-COP; C and D) with standard error shades. Participants were at the anterior-most position at 0% and 100%, of the sway cycle. At about 50% of the sway cycle, participants were at the posterior-most position. A and C: Experiment 1. The dashed line represents the mean data for PD patients and the solid line represents the mean data for the controls. B and D: Experiment 2. The dashed line represents the mean data for the off-drug condition and the solid line represents the mean data for the on-drug condition.
