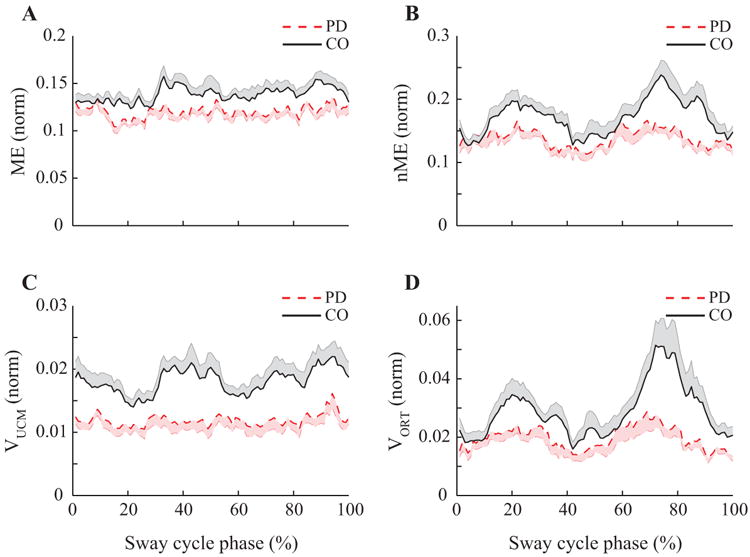
Figure 4.

Results of the motor equivalence and variance analyses in Experiment 1. Time-normalized profiles of the motor equivalent (ME, panel A) and non-motor equivalent (nME, panel B) components, variance within the UCM (VUCM, panel C), and within ORT (VORT, panel D) for PD patients (dashed line) and controls (CO, solid line). Note the higher magnitudes of all indices in the controls and the typical double-peaked patterns of nME and VORT.
