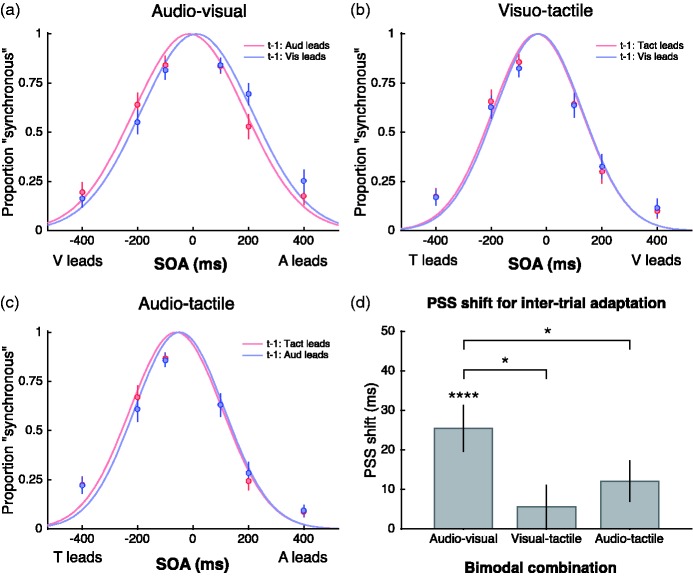
Figure 3.
An analysis of the inter-trial temporal recalibration effect. (a–c) Group mean data showing distributions of synchrony responses as a function of SOA in the test phase that followed the prolonged adaptation period. Responses were binned into one of two categories, depending on the stimulus order in the preceding test trial (e.g. vision led or audition led). Temporal recalibration effects are revealed by the best-fitting Gaussian functions being shifted in the direction of the leading stimulus during adaptation. (d) Group mean PSS difference between each order of adaptation after fitting Gaussian functions to each participant’s data. Error bars show ± 1 standard error.

