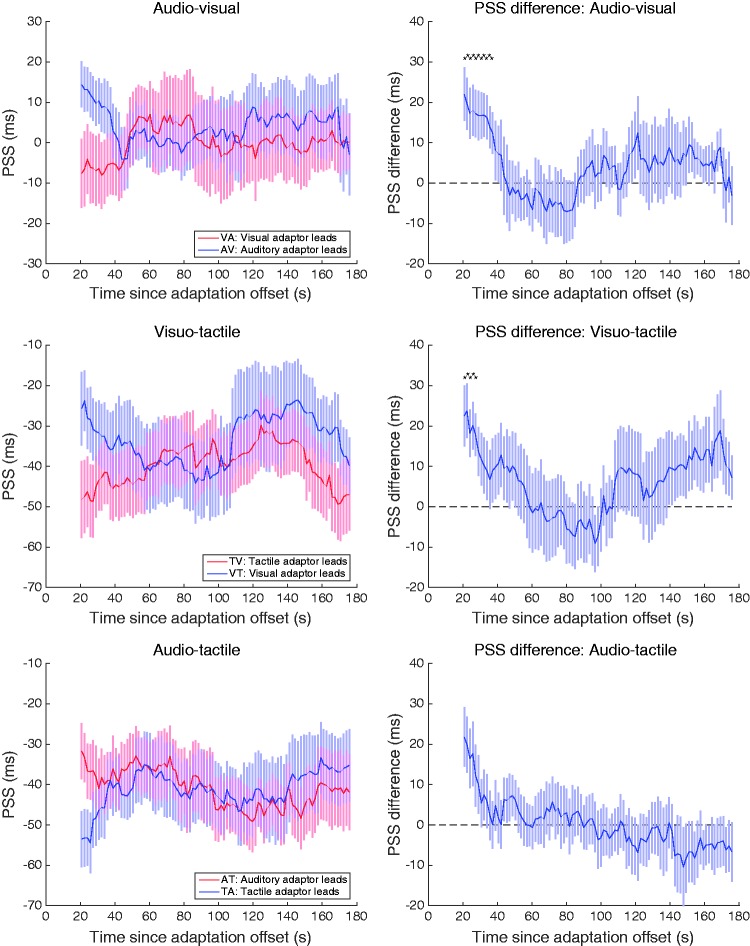
Figure 4.
Left-hand panels show group mean data using a ‘walking average’ over a 25-trial range to show how the temporal recalibration of PSS resulting from sustained adaptation changes over time after adaptation offset, as a function of the stimulus order during adaptation. As test trials had an average duration of 1.65 s, trial numbers have been converted to time elapsed since the end of adaptation by multiplying trial number by trial duration. Right-hand panels plot the difference between the left-hand functions to illustrate the decay of the recalibration effect induced by sustained adaptation to asynchrony. Black asterisks indicate significant differences after correction for multiple comparisons using the false discovery rate method (α = .05). All error bars show ± 1 standard error of the mean.

