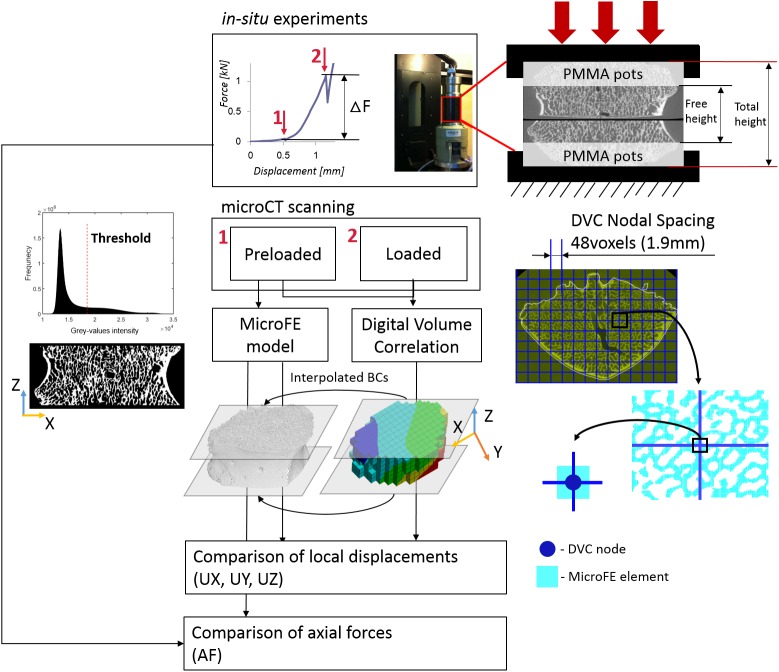
Fig 1. Workflow used to compare predicted and experimental local displacements and axial forces predicted.
An example of the step-wise load displacement curve is reported on the top highlighting the Preloaded (1) and Loaded (5% apparent strain, 2) conditions. A picture of the loading jig and a scheme of the sample fixation are reported on the top-right corner. The Digital Volume Correlation (DVC) algorithm was applied to the Preloaded and Loaded images to calculate the map of displacement in the whole vertebral body. MicroFE models of the vertebral body between the PMMA pots were generated from the preloaded image after the application of a single level threshold chosen from the analyses of the frequency plot of the grey-values and visual inspection. The displacement values at the top and bottom layer of the microFE models were assigned by interpolation of the DVC measurements in those planes. Displacements along the axial (Z) and transverse (X, Y) directions were compared between microFE predictions and DVC measurements at the nodes of the DVC grid that lay within microFE elements. Predicted axial forces were compared to those measured from the experimental load-displacement curves (ΔF).

