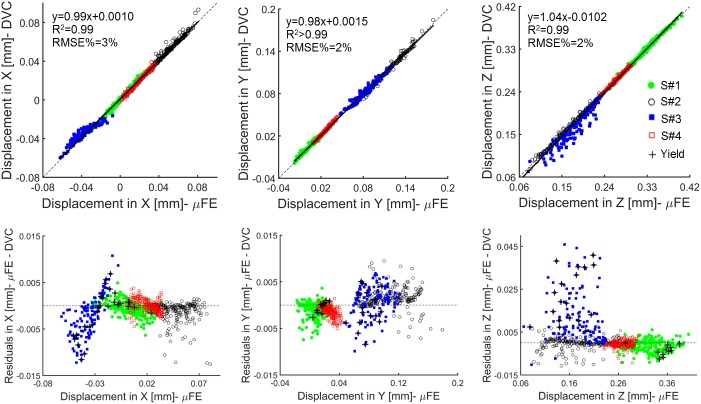
Fig 2. Linear regression and residual analysis estimated between predicted and experimental local displacements for pooled data.
Top: correlation between the displacements along the transverse (X, Y) and axial (Z) directions computed by the microFE models and measured experimentally by the DVC approach for the pooled data. Bottom: plots of the residuals. The elements with tensile or compressive strains beyond the yield limits (ɛp1Y = 7200μɛ and ɛp3Y = -8000μɛ for vertebral trabecular bone [44]) are reported with black crosses.

