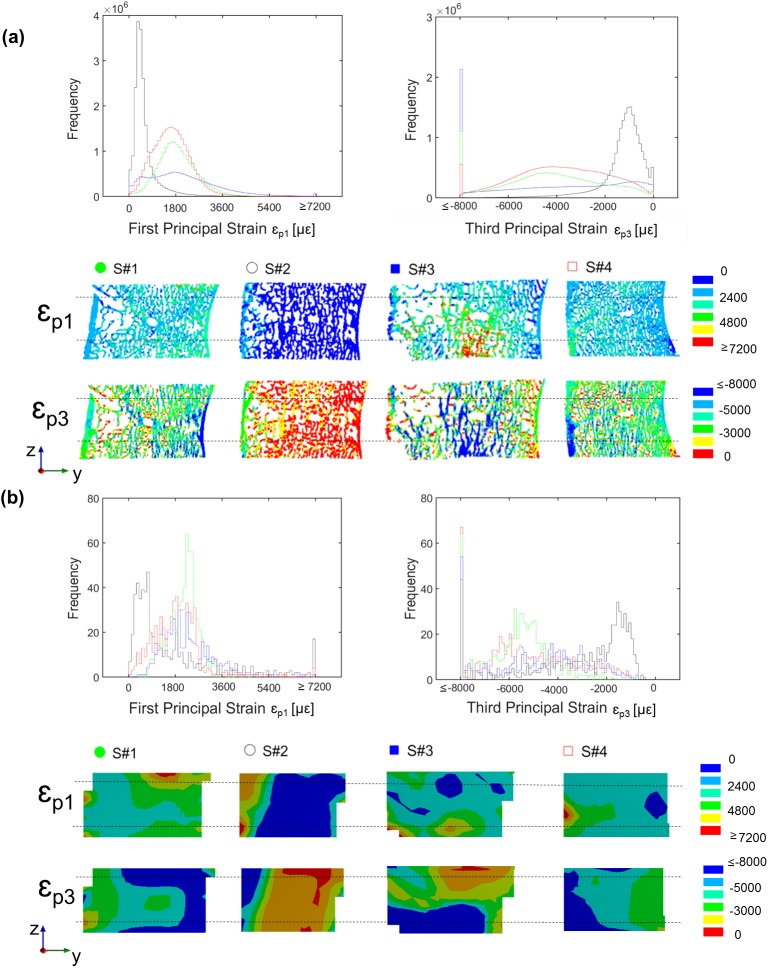
Fig 4.
Distribution of first and third principal strains from microFE models (a) and DVC measurements (b) for each specimen. For both sub-graphs in the top the frequency plots of the first (tension, ɛp1) and third (compression, ɛp3) principal strains are reported for the middle portion of each microFE model (a) and for the corresponding region from the DVC analysis (b). The highest and lowest bins represent the number of elements beyond the yield. For both sub-graphs in the bottom the rendering of strain distribution calculated from the microFE models (a) and DVC analysis (b) are reported for a sagittal mid-section (posterior on the left, anterior on the right) for each specimen. Black dashed lines represent the portion of the microFE models and DVC analysis included in the calculation of the frequency plots.

