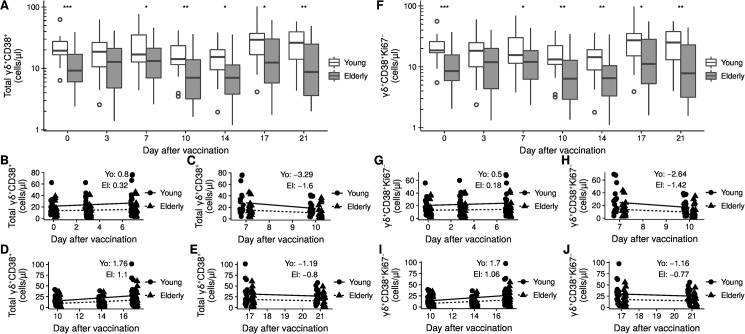
Fig 3. Dynamic changes of activated γδ T cells.
A) Kinetics of absolute count of total CD38+ after vaccination. B) Linear fit for day 0 to 6, C) day 7 to 10, D) day 10 to 17, and E) day 17 to 21. F) Kinetics of absolute count of CD38+Ki67– after vaccination. G) Linear fit for day 0 to 6, H) day 7 to 10, I) day 10 to 17, and J) day 17 to 21. The box in figures A and F represents the 25th, 50th, and 75th percentile and the whiskers the range excluding outliers (open circles). Asterisks indicate p-values (*** < 0.001; ** p < 0.01; * p < 0.05) after comparison with Student's t-test. p-values were corrected by the FDR method and only significant differences are shown. The two age groups in figures B-E and in G-J are slightly offset to the day of measurement to improve the visualization. Each point represents a single donor. The formula y = β + αx was fitted in B-E and G-J. The given values indicate the proportionality constant α.

