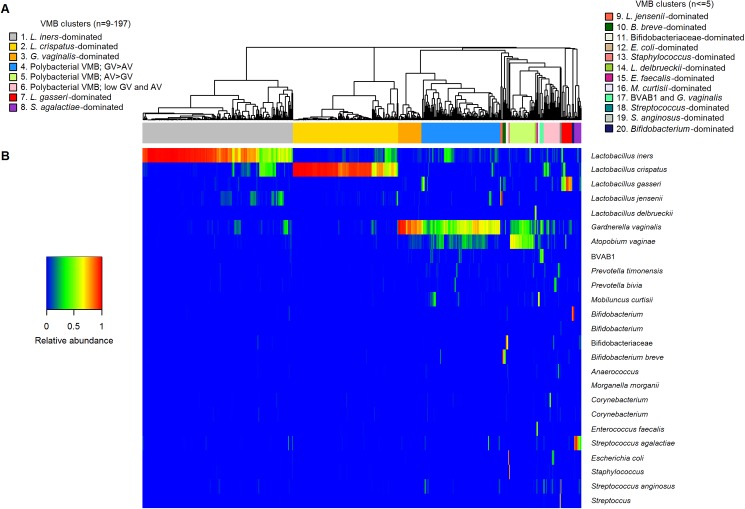
Fig 1. Hierarchical clustering of participants by VMB composition.
AV = Atopobium vaginae; BVAB1 = BV-associated bacterium 1; GV = Gardnerella vaginalis; L = Lactobacillus; OTU = operational taxonomic unit; VMB = vaginal microbiota. A. The 20 VMB clusters obtained by hierarchical clustering of 546 vaginal samples. Clustering was based on the relative abundance of 455 OTUs. B. Heatmap showing the relative abundance of the most abundant OTUs using the color key on the left.

