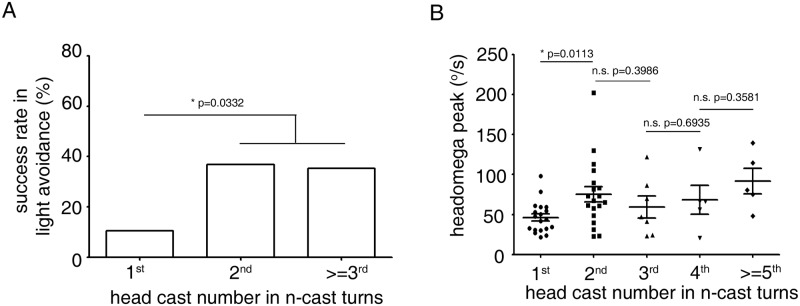
Fig 4. Second head casts are different from first head casts in n-cast turns.
(A) Success rates of first-cast, second-cast and n> = 3-casts in n-cast turns in light avoidance. n = 19, 19 and 17 for 1st, 2nd and > = 3rd cast.*,P<0.05, Fisher’s exact test. (B) Peak headomega values of head casts in n-cast turns. The amplitude of the second head cast is significantly larger than that of the first head cast. n = 19, 19, 7, 5 and 5 for 1st, 2nd, 3rd, 4thand > = 5th cast. *,P<0.05, n.s. not significant, t-tests.

