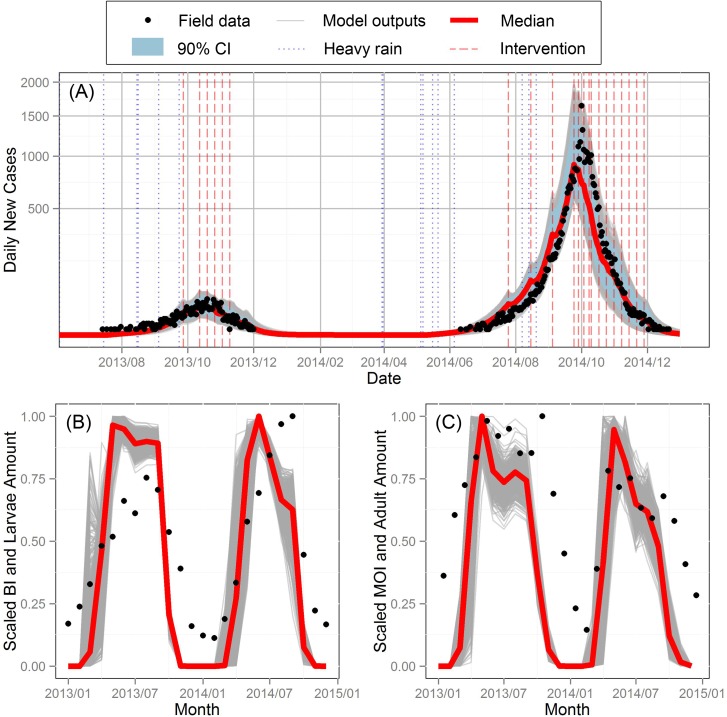
Fig 3.
Model outputs and field data for (A) daily new cases, (B) larvae and (C) adults. Black dots indicate the number of reported daily new dengue cases in (A), the scaled monthly average BI and MOI in (B) and (C), respectively. Gray and red solid lines represent the model output of each parameter set and the median of these outputs, respectively. Dotted blue and dashed red vertical lines are the dates for heavy rain (part of the immature stages will be washed out if the water level is close to its maximum value) and interventions (insecticide spraying and pooled water removal).

