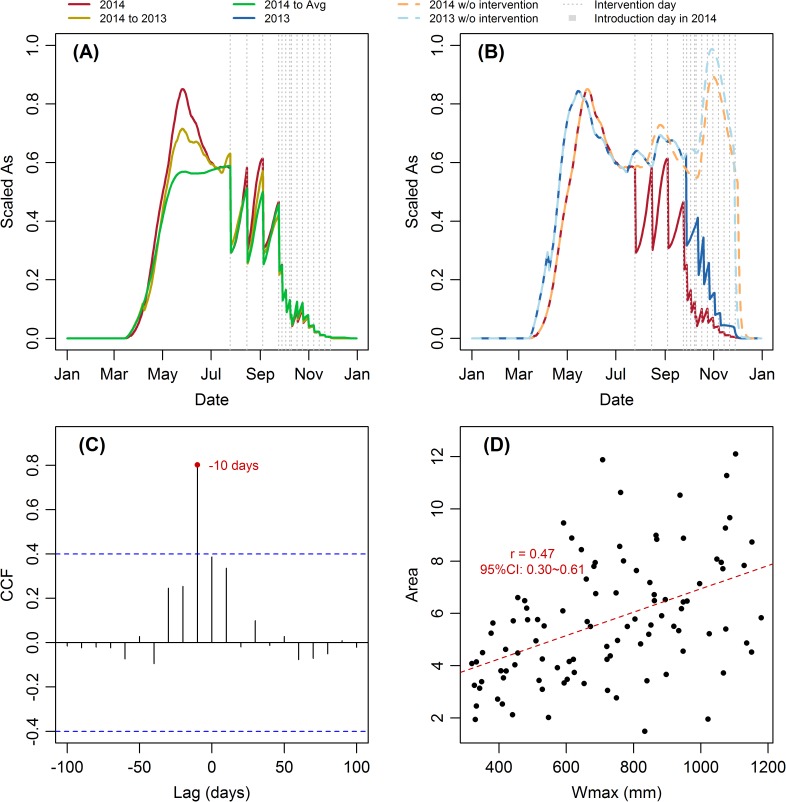
Fig 9. Relationship between As, ωmax and success rate.
Average scaled As of 100 parameter sets under (A) Scenario 2014, 2014 to 2013, and 2014 to Avg, and (B) Scenario 2014, 2013, 2014 w/o intervention, and 2013 w/o intervention. Since the absolute values of As may vary several magnitude between different parameter sets, the relative values of As were used by scaling the As to 0–1 to make them have the same weight on the mean value. (C) The average CCF between the difference of success rate and the difference of As under Scenario 2014. (D) Scatterplot of ωmax in each parameter set and the area between the success rate under Scenario 2014 and 2014 to Avg of the same parameter set.

