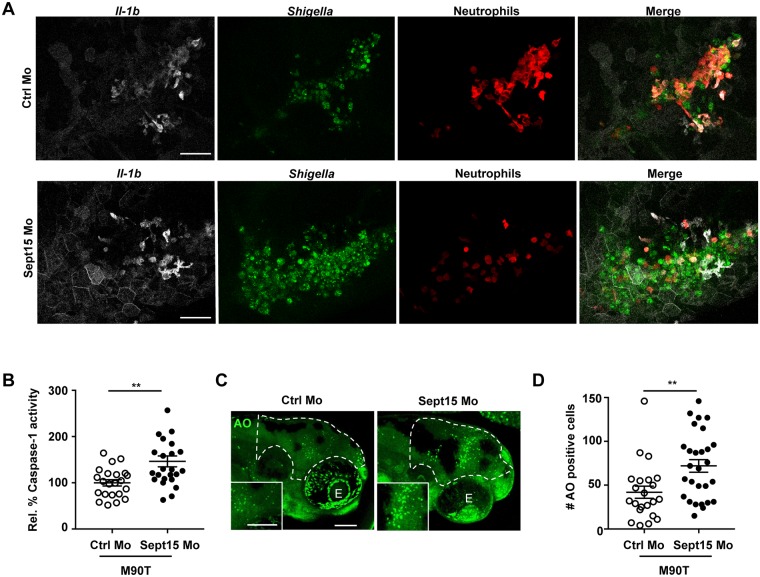
Fig 4. Sept15 restricts the inflammatory response in vivo.
A. Representative frames extracted from in vivo time-lapse confocal imaging of Tg(il-1b:GFP-F) x Tg(lyz:dsRed) larvae (3 dpf) injected with Ctrl or Sept15 Mo and infected in the HBV with Crimson-S. flexneri M90T (low dose) at 19 hpi. Maximum intensity Z-projection images (2 μm serial optical sections) are shown. Scale bars, 50 μm. See also S8 and S9 Videos. B. Relative % of Caspase-1 activity levels measured in Ctrl and Sept15 morphants infected for 6 h with ~5 x 10³ CFU of S. flexneri M90T. Mean±SEM from 3 independent experiments per treatment using 5–10 larvae per experimental group. Significance testing performed by Student’s t test. **; P<0.01. C. Representative images of Ctrl and Sept15 morphants (Mo) infected with S. flexneri M90T in the HBV and stained for acridine orange. Dotted line shows the area where cells were quantified (i.e. the infected HBV). Scale bars, 100 μm. E, eye. D. Number of acridine orange (AO) positive cells counted in the HBV of Ctrl or Sept15 morphants 6 hpi with S. flexneri M90T. Significance testing performed by Student’s t test. **, P<0.001. Pooled data from 3 independent experiments per treatment using at least 6 larvae per treatment.

