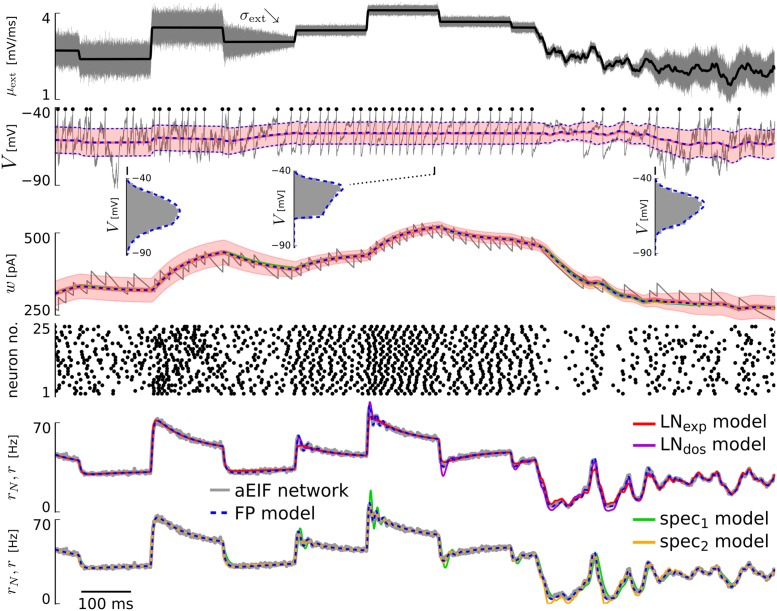
Fig 1. Example of aEIF network response and output of derived models for varying input.
From top to bottom: Mean input μext (black) together with input standard deviation σext (gray, visualized for one neuron by sampling the respective white noise process ξext,i). 2nd row: Membrane voltage V of one neuron (gray, with spike times highlighted by black dots) and membrane voltage statistics from the excitatory coupled aEIF population of 50,000 neurons (red) and from the FP model (blue dashed): mean ± standard deviation over time, as well as voltage histograms (gray) and probability densities p(V, t) (blue dashed) at three indicated time points. 3rd row: Adaptation current w of one neuron (gray) and mean adaptation currents of all models ± standard deviation for the aEIF network (shaded area). Note that differences in the mean adaptation currents of the different models are hardly recognizable. 4th row: Spike times of a subset of 25 neurons randomly chosen from the network. Below: Spike rate r of the LN cascade based models (LNexp, LNdos) and the spectral models (spec1, spec2) in comparison to the FP model and the aEIF network (rN). The values of the coupling parameters were J = 0.05 mV, K = 100, τd = 3 ms.

