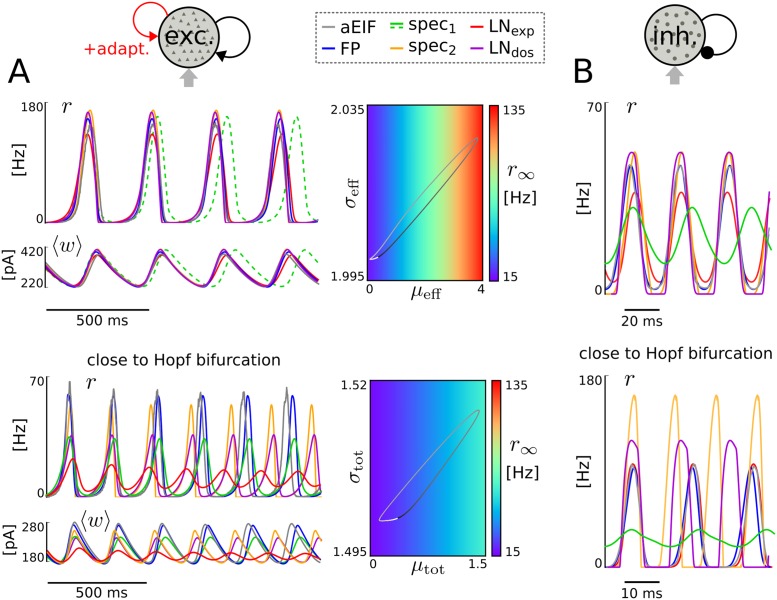
Fig 5. Network-generated oscillations.
Oscillatory population spike rate and mean adaptation current of 50,000 excitatory coupled aEIF neurons and each of the derived models (for constant external input moments) generated by the interplay of recurrent excitation/adaptation current (A) and by delayed recurrent inhibition (B). In addition, the limit cycle of the LNexp model is shown in terms of the (quantity) steady-state spike rate r∞ as a function of effective input moments μeff, (A, top) and for the spec2 model in dependence of the total input moments (μtot, (A, bottom). The phase of the cycle is visualized by grayscale color code (increasing phase from black to white). The values for the input, adaptation and coupling parameters were μext = 1.5 mV/ms, , a = 3 nS, b = 30 pA (A, top), μext = 1.275 mV/ms, , a = 3 nS, b = 60 pA (A, bottom), K = 1000, J = 0.03 mV, τd = 3 ms (A, both). In B adaptation was removed (a = b = 0) and delays were identical dij = d; input and coupling parameter values were μext = 1.5 mV/ms, , K = 1000, J = −0.0357 mV, d = 10 ms (top) and μext = 3 mV/ms, , K = 1000, J = −0.087 mV, d = 5 ms (bottom).

