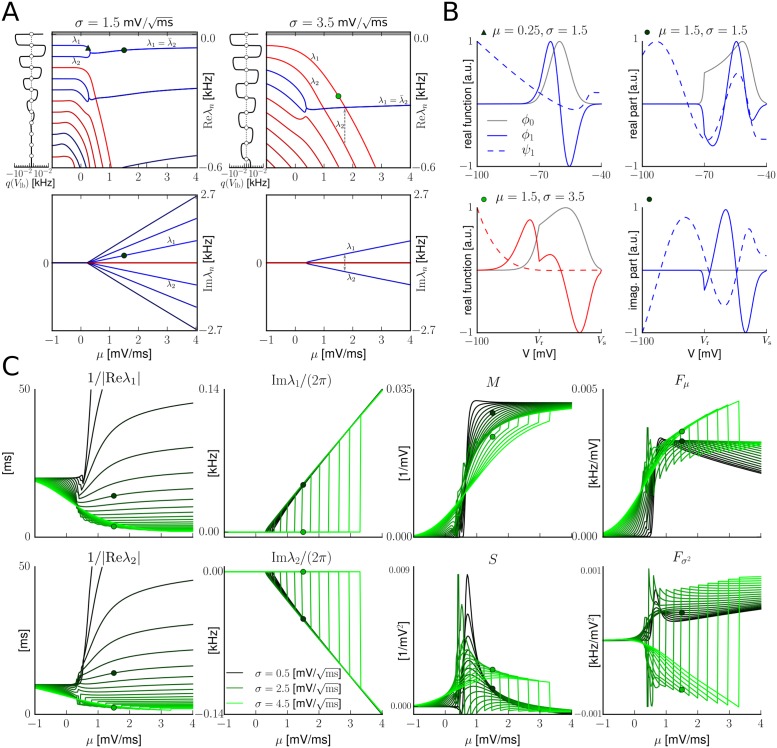
Fig 7. Spectrum of the Fokker-Planck operator and related quantities.
A: regular eigenvalues of (blue) and diffusive ones (red) with real and imaginary part (top and bottom, respectively) as a function of the mean input μ for small noise intensity σ (left) and larger input fluctuations (right). The first two dominant eigenvalues λ1, λ2 are indicated together with discontinuities in the real (λ2) and imaginary part (λ1 and λ2), respectively. The stationary eigenvalue λ0 = 0 is shown in gray. Note that the value of the mean input μ at which the eigenvalue λn changes from real to complex values depends on the noise amplitude σ and the eigenvalue index n which is difficult to see in the figure. The narrow winding curves attached to the left side of the respective spectra represent the lower bound flux q(Vlb) for μmin = −1.5 mV/ms as a function of (real) eigenvalue candidate λ. The flux axis has a logarithmic scale between the large ticks (absolute values between 10−10 and 10−2 kHz) and is linear around the dashed zero value. The open circles denote the eigenvalues, i.e., those λ that satisfy q(Vlb) = 0. Note that q(Vlb) ranges over several orders of magnitude. B: stationary eigenfunction ϕ0 = p∞ (gray) and nonstationary eigenfunctions ϕ1 of and ψ1 of corresponding to the first dominant eigenvalue λ1 for three different input parameter values indicated by the triangle and circles in A (same units of μ and σ as therein). The eigenfunctions are biorthonormalized, but (only) for visualization truncated at V = −100 mV and furthermore individually scaled to absolutely range within the unit interval of arbitrary units [a.u.]. C: first and second dominant eigenvalues λ1, λ2 with real and imaginary part (that are also indicated in A), as well as additional (real-valued) quantities of the model spec2 (M, S, Fμ, Fσ2) as a function of input mean μ and noise strength σ in steps of from small values (black) to larger ones (green). The dots indicate identical parameter values to the spectra of A and the eigenfunctions of B (darker: , brighter green: ).

