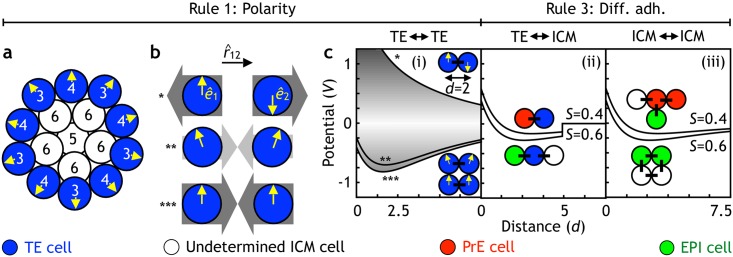
Fig 2. The overview of the physical interactions between cells.
(a) Polarity is applied to the surface cells at the 16-cell stage. Cells with 4 or fewer neighbors (numbers) acquire polarity (arrows) pointing radially out from the center of the embryo. These cells become the trophectoderm (TE) (blue), while the inner cells with 5 or more neighbors become the undetermined inner cell mass (ICM), coexpressing primitive endoderm (PrE) and epiblast (EPI) markers (white). (b) The 3 types of interaction between 2 TE cells (blue). In case the polarity unit vectors (arrows, ê) are or become antiparallel (*), the repulsion is maximal (dark gray arrows); although, in our simulations, this configuration does not occur. When the polarities are misaligned, the potential is smaller (**), and the attraction is weak (light gray arrows). Finally, when the 2 polarities are parallel, the potential is strong (***), and the cell attraction is strongest. (c) The potentials applied between the different cell types in the model. All cells are illustrated as unit circles, and the potentials are given by Eq 2. (i) Potential between TE cells depends on the orientation of cell polarities (arrows) given by Eq 1. To implement nearest-neighbor interaction potential, TE cells only interact with other TE cells within d < 2.5. (ii) Interaction potential between the TE and ICM cells (PrE cells in red, EPI cells in green, and undetermined ICM cells in white). The range of the potential is limited to about 2 cell diameters (V = 0 for d > 5). PrE progenitors interact weaker with TE cells (S = 0.4) compared to either undetermined ICM or EPI cells (S = 0.6). (iii) Interaction potentials between ICM cells. As in (ii), PrE progenitors interact weaker with any of the ICM cells (S = 0.4) compared to EPI—EPI, EPI—undetermined ICM, or undetermined ICM—undetermined ICM (S = 0.6).

