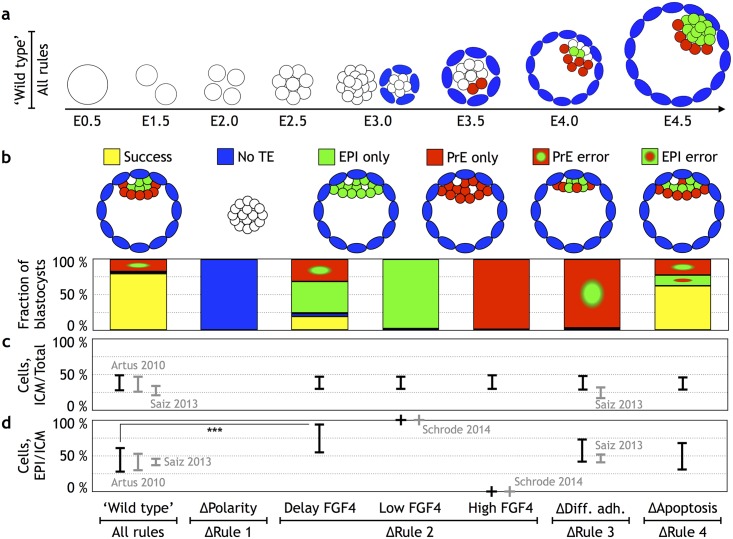
Fig 3. Quantifying the relative contribution of the rules to the robustness of the blastocyst development.
(a) Screenshots from a representative simulation (compare with Fig 1, and see also S1 Movie). At embryonic day (E)3.0, both the configuration before and after adding polarities are shown. Undetermined inner cell mass (ICM) cells are white, trophectoderm (TE) cells are blue, epiblast (EPI) cells are green, and primitive endoderm (PrE) cells are red. (b) Quantification of the developmental success in in silico blastocysts at E4.5. The configuration of the successfully developed blastocyst is shown in the upper-left panel. The occurrence of such a configuration (79% out of 200 simulations in wild type) is color coded by yellow. Perturbing 1 of the 4 rules results in 5 additional configurations (upper panel): no TE formation (blue), EPI only (green), PrE only (red), EPI progenitor within the PrE (red with a green dot), and PrE progenitors found within the EPI (green with a red dot). The “ΔRule 2 low/high FGF” represents cases in which fibroblast growth factor (FGF) signaling is depleted or is in excess FGF4, which corresponds to data in Yamanaka et al. [27] and Saiz et al. [71]. The “ΔRule 2 delay FGF4” represents the case in which FGF signaling was inhibited for 24 hours from E2.5–E3.5, and the inhibitor is removed at E3.5–E4.5. (c) The fraction of ICM cells to the total number of cells at E4.5 in the 7 different types of embryos. (d) The fraction of EPI cells to ICM cells at E4.5. Both in (c) and in (d), experimentally reported numbers are presented in gray, while black error-bars represent numbers predicted by the model. The simulation data can be found in S1 Data. To compare 2D simulations with 3D experimental results, the numbers were rescaled to 3D (see Materials and methods). The simulation results are similar in 3D model (see S2 Movie).

