
Figure 2.
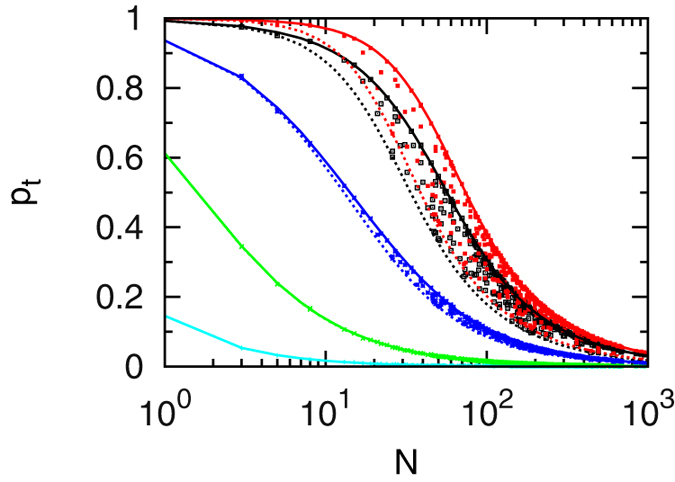
Probability  to detect the target before dissociation as function of the target region length
  . Symbols: simulations using 500 different configurations with 50,000 runs for each. Lines: simplified theoretical model with a centred target (full lines) and a target at the boundary (dashed lines). Parameters (in units of
  ):
):  ,
,  ,
,  ,
,  . Colours: cyan (
 ), green (
 ), blue (
 ), black (
 ) and red (
 ).
).