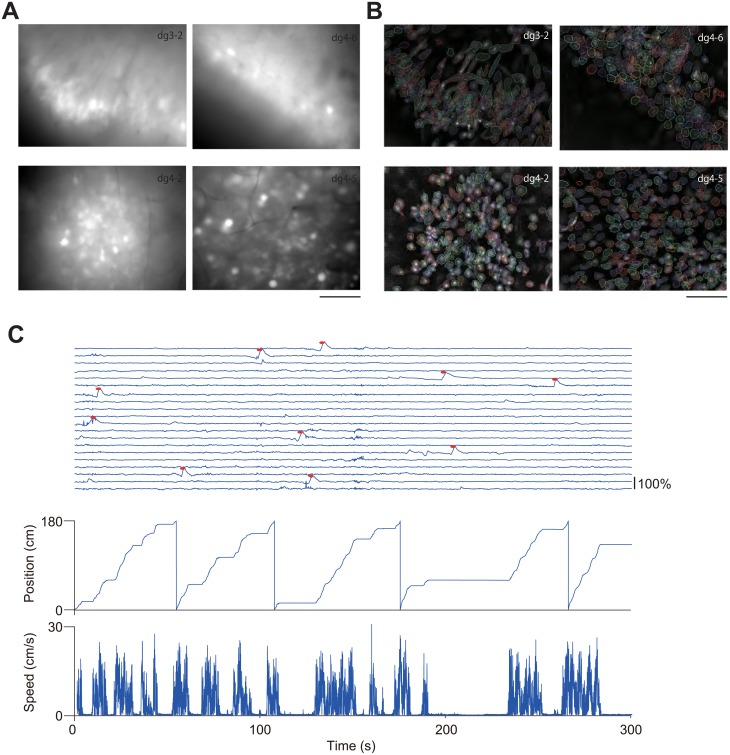
Fig 3. Imaging the dentate gyrus in behaving mice.
(A) Averaged fluorescence images across entire recording session. Scale bar, 100 μm. (B) Contours of putative cell bodies identified with a PCA and ICA-based cell sorting algorithm (Cellsort 1.0, Mukamel et al., 2009). Scale bar, 100 μm. (C) Traces of dF/F calcium signal were shown. Identified calcium transients are shown as red dots. The position of the mouse along the virtual track is shown at the bottom. Animal position and speed in the virtual track was shown in the bottom.

