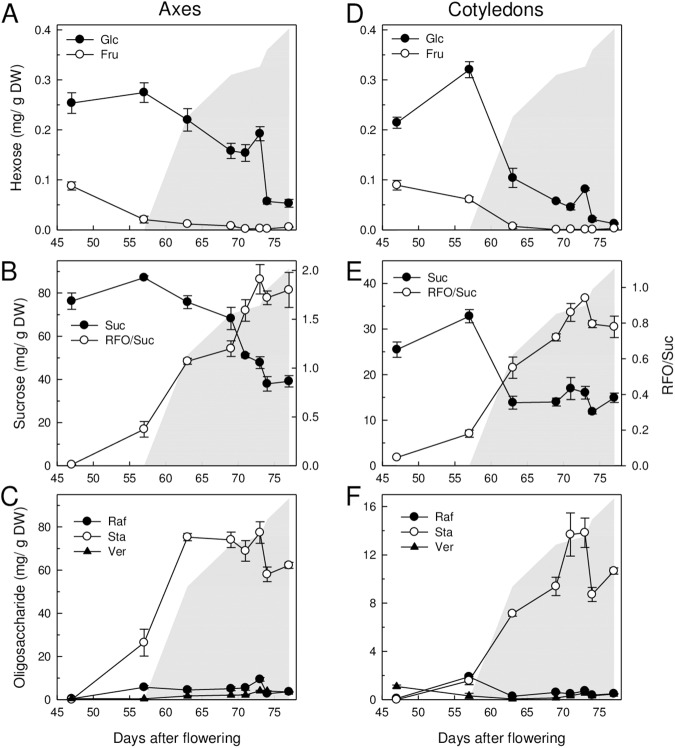
Fig 5. Changes in soluble sugar contents in axis and cotyledons during maturation.
Data are the average of triplicates (± SE) using 6 axis (A-C) and 6 cotyledon pairs (D-E) from the 2014 crop. The changes in RFO/Suc ratio are shown in panel B and E for axes and cotyledons, respectively. The increase in longevity (P50) is indicated as a grey area as a help to the eye. (A, D) Glc, glucose and Fru, fructose; (B, E) Suc, sucrose and RFO/Suc ratio; (C, F) Raf, Raffinose, Sta, Stachyose and Ver, Verbascose.

