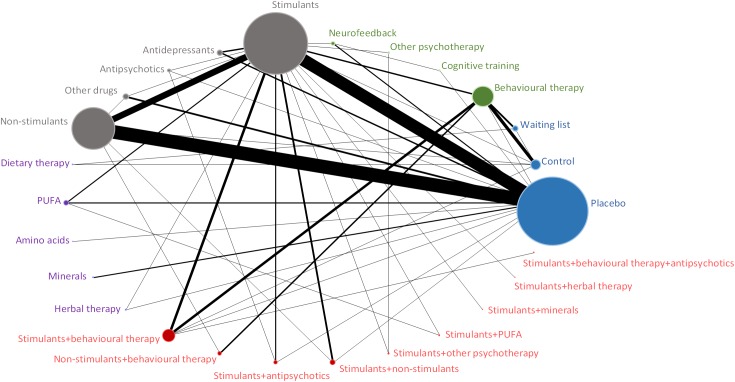
Fig 1. Evidence network diagram for primary outcome of efficacy among therapeutic classes.
Solid lines represent direct comparisons within randomised trials. Nodes in blue represent controls. Nodes in green represent psychological interventions. Nodes in grey represent pharmacological interventions. Nodes in purple represent complementary and alternative medicine interventions. Nodes in red represent combined interventions. Size of node is proportional to number of randomised trials, and thickness of line connecting nodes is proportional to number of randomised trials directly comparing the two treatments. PUFA = polyunsaturated fatty acids.

