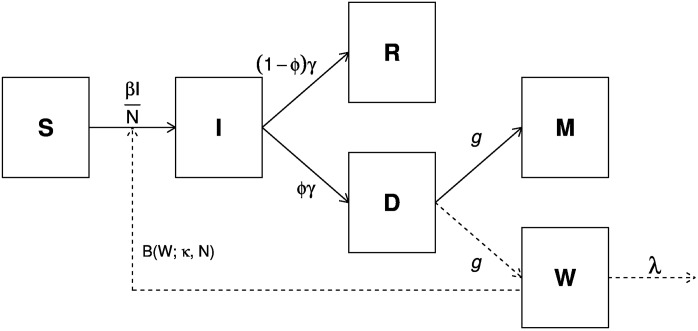
Fig 2. Schematic diagram showing the transmission dynamics during an influenza pandemic.
S, I and R denote the number of susceptible, infectious, and recovered individuals, respectively; D denotes the number of infected individuals who are no longer infectious and are progressing to death in influenza or pneumonia causes; M denotes the cumulative number of influenza-related deaths; and W denotes recent influenza mortality, a proxy indicator for the perception of pandemic severity.

