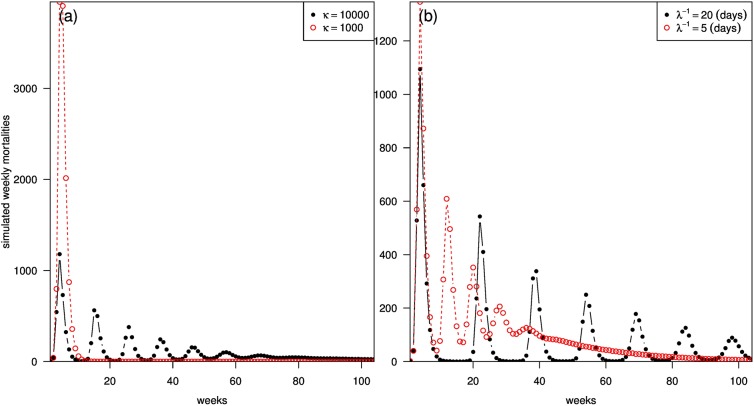
Fig 7. Cumulative number of weekly mortality using different values of κ and λ.
With N = 2,000,000, S0 = 0.8N, I0 = 100, g−1 = 8, γ−1 = 4 and ϕ = 0.01, the effects of κ and λ on the simulated weekly mortalities are shown in panels (a) and (b) respectively. In panels (a), we fixed λ−1 = 10 days, and the cumulative weekly mortalities are 16% smaller when we have κ = 10,000 than κ = 1,000. In panel (b), when we fixed κ = 10,000, the cumulative weekly mortalities will be 27% smaller when we have λ−1 = 5 days than λ−1 = 20 days.

