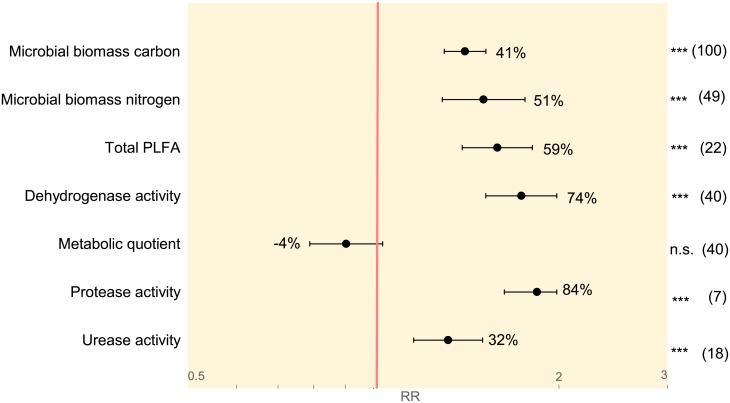
Fig 2. Summary of overall response ratios (RR).
Random effects model with a Z-Distribution and a 95% confidence interval was applied on seven target variables listed on the y-axis. The red line (RR = 1) indicates no difference between organic and conventional systems. X-axis is given in log-scale as indicated by grey numbers. Numbers in parentheses display the number of pairwise comparisons included in each calculation. Numbers beside the confidence intervals indicate the overall percentage difference per target variable. *≤0.05, **≤0.01, ***≤0.001, n.s. = not significant.

