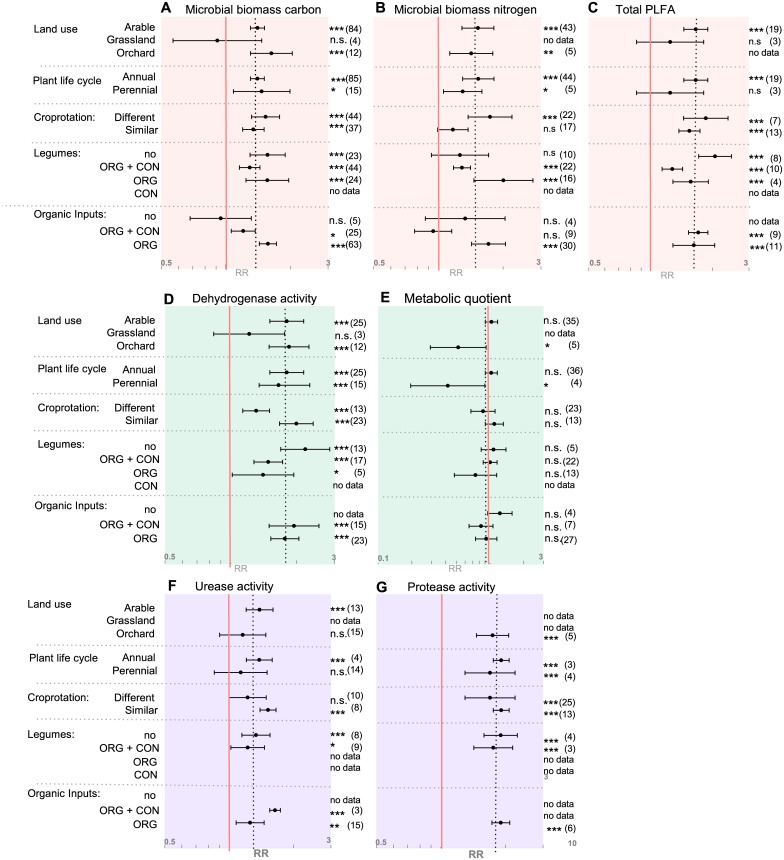
Fig 4. Summary of management categories for all target variables as affected by organic vs conventional farming systems.
Categorical random effects model (Knapp-Hartung) with a 95% confidence interval was applied. A response ratio (RR) of 1.0, marked with a red line, indicates no difference between organic and conventional systems. The overall RRs per target variable are indicated by the vertical black dotted lines. X-axis is given in log-scale as indicated with grey numbers. ‘No data’ indicates that less than three comparisons for a respective category were available and hence no analysis was performed. Numbers in parentheses indicate the number of pairwise comparisons included in each calculation. Different categories are listed on the y-axis. No = ‘no legumes’/‘no organic input’ in both farming systems. ORG = organic, CON = conventional/non-organic systems. Plots A-C summarize all target variables representing microbial size, D+E represent target variables for microbial activity and F+G represent target variables involved in nitrogen mineralization activity. Significance levels: *≤0.05, **≤0.01, ***≤0.001, n.s. = non-significant.

