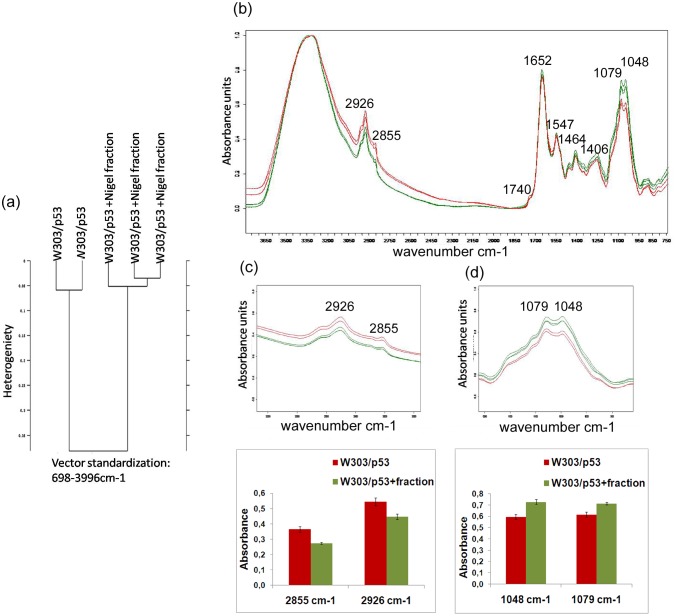
Fig 5. FTIR spectroscopy analysis of the whole recombinant yeast clones W303/p53 grown in MMGAL in absence and presence of purified Nigel extract.
(a) Dendrogram representing the cluster analysis of W303/p53 grown in MMGAL in absence and in presence of nigel fraction and W303/p53. (b) FTIR spectra of W303/p53 (red line) and W303/p53 (green line) grown on MMGAL in absence and presence of nigel fraction, (c) spectral intensity band changes in 3000–2820cm−1 region showing membrane changes and (d) spectral intensity band changes in 1187-945cm-1 region showing DNA changes. The values are means of three independent experiments.

