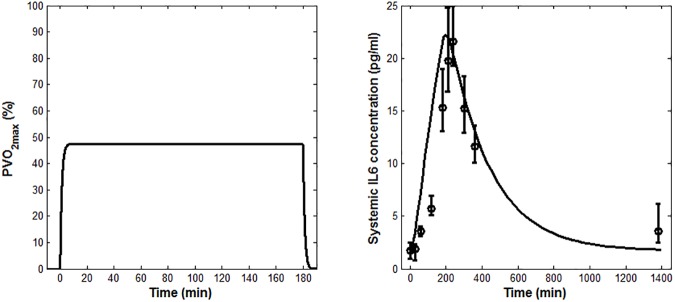
Fig 4. Model validation results obtained using the conditions reported in the study by Fischer et al.
(A) PVO2max model prediction (B) Measured IL-6 concentrations (means ± SEM) from Fischer et al. [30], shown along with the model prediction (solid line).

