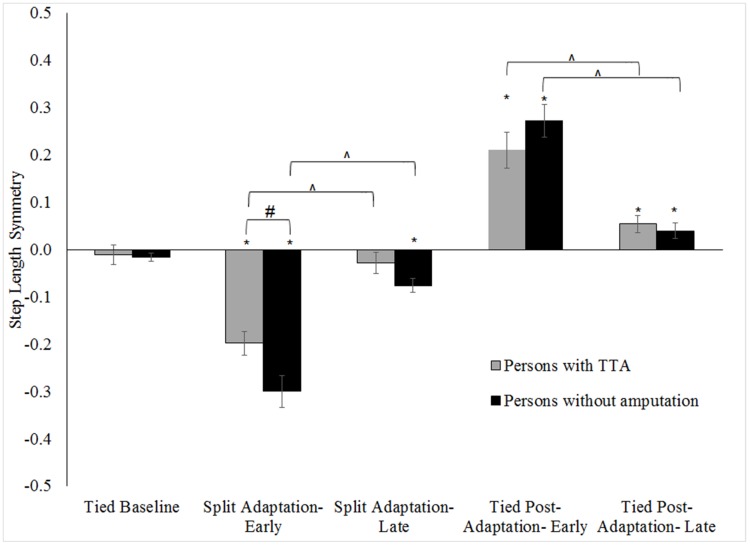
Fig 2. Comparison of step length symmetry across walking conditions for the persons with TTA and persons without an amputation.
Error bars indicate standard error. * Indicates within-group differences comparing conditions to the tied baseline (0.5 m/s) were statistically significance with p <.05. # Indicates the between group difference for a walking condition was statistically significance with p <.05. ^ indicates a statistically significant change during split adaptation or tied post-adaptation with p <.05. Note: Increased handrail use by persons with TTA resulted in more symmetrical step lengths than the persons without an amputation during early split adaptation.

